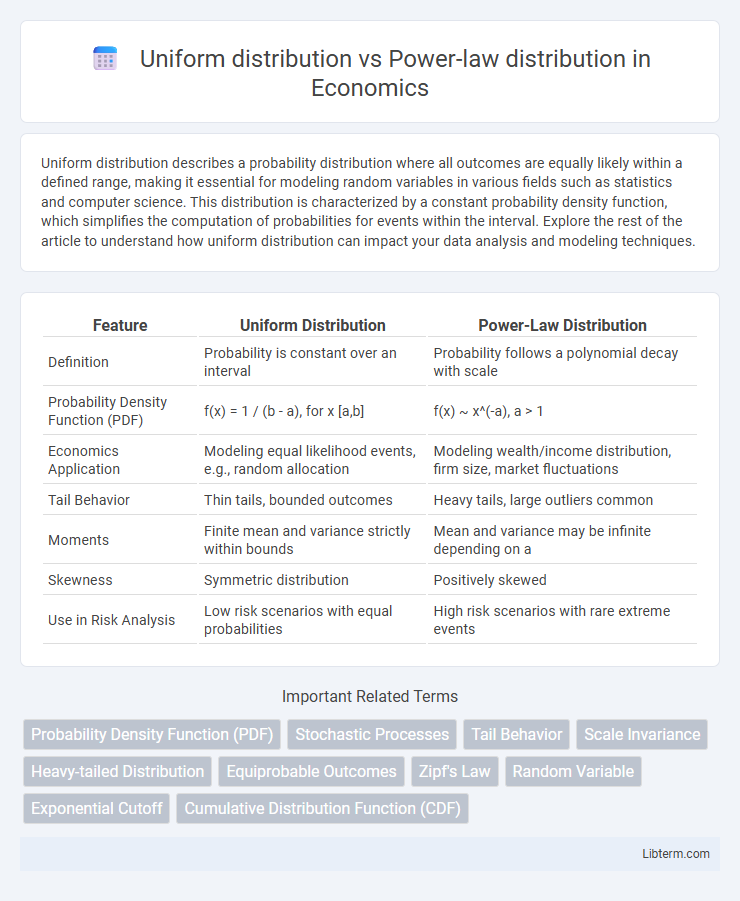
Uniform distribution describes a probability distribution where all outcomes are equally likely within a defined range, making it essential for modeling random variables in various fields such as statistics and computer science. This distribution is characterized by a constant probability density function, which simplifies the computation of probabilities for events within the interval. Explore the rest of the article to understand how uniform distribution can impact your data analysis and modeling techniques.
Table of Comparison
| Feature | Uniform Distribution | Power-Law Distribution |
|---|---|---|
| Definition | Probability is constant over an interval | Probability follows a polynomial decay with scale |
| Probability Density Function (PDF) | f(x) = 1 / (b - a), for x [a,b] | f(x) ~ x^(-a), a > 1 |
| Economics Application | Modeling equal likelihood events, e.g., random allocation | Modeling wealth/income distribution, firm size, market fluctuations |
| Tail Behavior | Thin tails, bounded outcomes | Heavy tails, large outliers common |
| Moments | Finite mean and variance strictly within bounds | Mean and variance may be infinite depending on a |
| Skewness | Symmetric distribution | Positively skewed |
| Use in Risk Analysis | Low risk scenarios with equal probabilities | High risk scenarios with rare extreme events |
Introduction to Probability Distributions
Uniform distribution assigns equal probability to all outcomes within a defined range, representing a constant likelihood across the interval, while power-law distribution exhibits a heavy-tailed behavior where few events dominate with high probability and many events have low probability. The uniform distribution is characterized by a flat probability density function, ideal for modeling scenarios with no preferential outcomes. In contrast, power-law distributions follow the form P(x) ~ x^(-a), capturing phenomena in natural and social systems where extreme events occur more frequently than predicted by uniform or normal distributions.
What is a Uniform Distribution?
A Uniform Distribution is a probability distribution where all outcomes are equally likely within a defined range, characterized by a constant probability density function. Unlike Power-law distributions, which have heavy tails and indicate that small occurrences are extremely common while large ones are rare, Uniform distributions have no bias toward any specific value. This makes Uniform distributions ideal for modeling scenarios where each event has an equal chance of occurring, such as random number generation in a fixed interval.
What is a Power-law Distribution?
A power-law distribution is a probability distribution characterized by the relationship P(x) x^(-a), where a is a positive constant known as the scaling exponent. Unlike a uniform distribution, which assigns equal probability across all outcomes, a power-law distribution exhibits heavy tails, indicating that extreme events are more probable than in exponential or normal distributions. This distribution is commonly observed in natural and social phenomena, including earthquake magnitudes, wealth distribution, and network connectivity.
Key Differences Between Uniform and Power-law Distributions
Uniform distribution features equal probability for all values within a specific range, resulting in a constant probability density function. Power-law distribution characterizes data with heavy tails, where small occurrences are common but large events have a non-negligible probability, following the form P(x) ~ x^(-a). Unlike uniform distribution's flat profile, power-law distributions exhibit scale invariance and are often used to model phenomena like wealth distribution, earthquake magnitudes, and network connectivity.
Mathematical Representation and Formulas
Uniform distribution is mathematically represented by a constant probability density function (PDF) over an interval [a, b], expressed as f(x) = 1/(b - a) for a <= x <= b, with zero probability elsewhere. Power-law distribution follows the form f(x) = Cx^(-a), where a > 1 is the scaling exponent and C is a normalization constant ensuring the total probability integrates to one, defined for x >= xmin. Unlike uniform distribution's equal likelihood across values, power-law distribution emphasizes the heavy-tailed property where smaller events are common and larger events occur with a probability proportional to a power of their size.
Real-world Examples and Applications
Uniform distribution models scenarios where outcomes have equal probability, such as random number generation in computer simulations and lottery draws, ensuring fairness and unpredictability. Power-law distribution appears in natural and social phenomena like earthquake magnitudes, city population sizes, and wealth distribution, reflecting heavy-tailed behavior where few occurrences dominate. These distributions guide decision-making in risk assessment, urban planning, and network theory by characterizing event likelihoods and scaling properties.
Visualization and Graphical Comparisons
Uniform distribution graphs display data with constant probability across all values, resulting in flat, rectangular histograms or evenly spaced scatter plots. Power-law distribution visualizations typically exhibit heavy-tailed behavior with steep slopes on log-log plots, highlighting the presence of rare but significant large events. Comparing their graphical representations reveals uniform distribution's equal data spread versus power-law's skewed concentration of values towards smaller magnitudes and occasional extreme outliers.
Impact on Statistical Analysis
Uniform distribution assumes equal probability across all outcomes, simplifying statistical analysis by providing consistent variance and predictable sampling properties. Power-law distribution exhibits heavy tails with rare but extreme values, complicating inference and biasing estimators due to infinite variance in some cases. Understanding these differences is crucial for accurate modeling of real-world phenomena, especially in risk assessment and network analysis.
Choosing the Right Distribution for Data Modeling
Uniform distribution assumes equal probability across all outcomes, ideal for modeling data with no inherent bias or variation. Power-law distribution captures phenomena with heavy tails and scale-free properties, suitable for data exhibiting large disparities like wealth or network connections. Selecting the right distribution depends on analyzing data characteristics such as range uniformity, occurrence frequency, and tail behavior to ensure accurate modeling and prediction.
Conclusion: Implications in Research and Industry
Uniform distribution models scenarios where events have equal probabilities, providing simplicity and predictability in research and industrial applications such as quality control and randomized algorithms. Power-law distribution captures phenomena with heavy tails and scale invariance, critically informing risk management, network theory, and natural event modeling. Understanding the fundamental differences guides researchers and industry professionals in selecting appropriate statistical tools for accurate data interpretation and decision-making.
Uniform distribution Infographic

 libterm.com