The Capital Allocation Line (CAL) represents the risk-return trade-off of combining a risk-free asset with a risky portfolio to create a range of investment options tailored to your risk tolerance. Understanding the CAL helps investors optimize their portfolios by identifying the best mix of assets for achieving desired returns with acceptable risk. Explore the rest of this article to learn how the Capital Allocation Line can enhance your investment strategy.
Table of Comparison
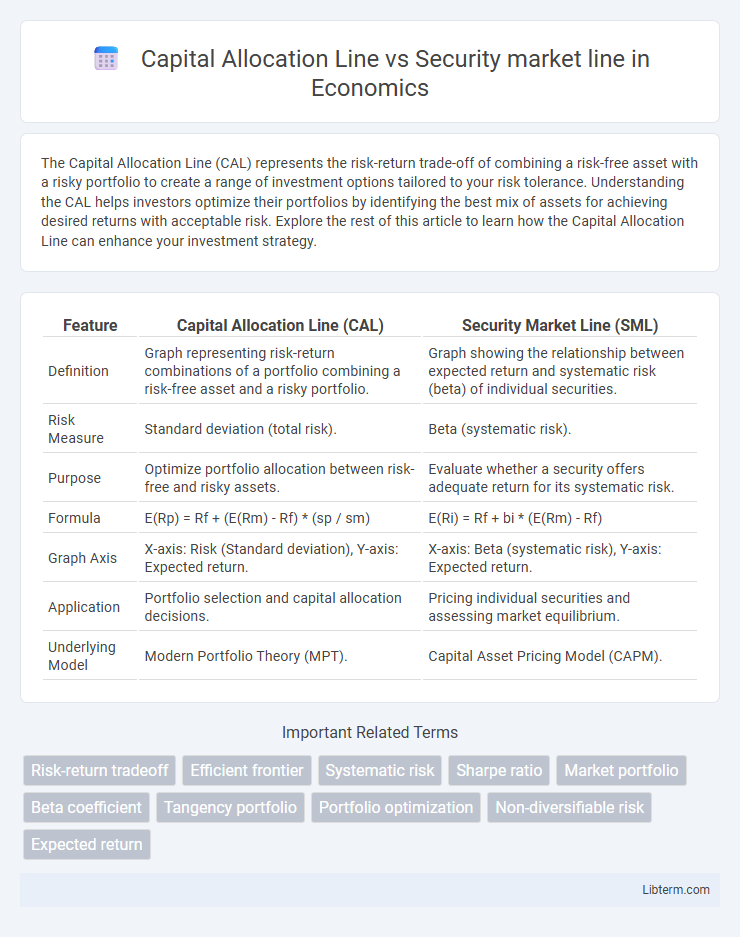
| Feature | Capital Allocation Line (CAL) | Security Market Line (SML) |
|---|---|---|
| Definition | Graph representing risk-return combinations of a portfolio combining a risk-free asset and a risky portfolio. | Graph showing the relationship between expected return and systematic risk (beta) of individual securities. |
| Risk Measure | Standard deviation (total risk). | Beta (systematic risk). |
| Purpose | Optimize portfolio allocation between risk-free and risky assets. | Evaluate whether a security offers adequate return for its systematic risk. |
| Formula | E(Rp) = Rf + (E(Rm) - Rf) * (sp / sm) | E(Ri) = Rf + bi * (E(Rm) - Rf) |
| Graph Axis | X-axis: Risk (Standard deviation), Y-axis: Expected return. | X-axis: Beta (systematic risk), Y-axis: Expected return. |
| Application | Portfolio selection and capital allocation decisions. | Pricing individual securities and assessing market equilibrium. |
| Underlying Model | Modern Portfolio Theory (MPT). | Capital Asset Pricing Model (CAPM). |
Introduction to Capital Allocation Line (CAL) and Security Market Line (SML)
The Capital Allocation Line (CAL) represents the risk-return combinations achievable by mixing a risk-free asset with a portfolio of risky assets, illustrating the trade-off between expected return and portfolio risk (standard deviation). The Security Market Line (SML) depicts the relationship between an asset's expected return and its systematic risk (beta), serving as a graphical representation of the Capital Asset Pricing Model (CAPM). While CAL focuses on total portfolio risk and return, SML emphasizes the pricing of individual securities based on market risk.
Defining the Capital Allocation Line (CAL)
The Capital Allocation Line (CAL) represents the risk-return trade-off of a portfolio combining a risk-free asset and a risky asset, illustrating all possible combinations of expected return and standard deviation. It is defined by the slope of the Sharpe ratio, which measures excess return per unit of risk, guiding investors in optimal capital distribution between risk-free and risky investments. In contrast, the Security Market Line (SML) plots expected return against systematic risk (beta), reflecting equilibrium in the capital asset pricing model (CAPM), while CAL specifically addresses portfolio combinations involving a risk-free component.
Understanding the Security Market Line (SML)
The Security Market Line (SML) represents the relationship between expected return and systematic risk, measured by beta, for individual securities or portfolios in the Capital Asset Pricing Model (CAPM). It serves as a benchmark to evaluate whether a security offers a fair expected return for its risk level, reflecting market equilibrium under efficient market assumptions. Unlike the Capital Allocation Line (CAL), which depicts risk-return trade-offs combining a risk-free asset and a risky portfolio, the SML specifically accounts for systematic risk and helps identify overvalued or undervalued securities.
Key Differences Between CAL and SML
The Capital Allocation Line (CAL) represents the risk-return combinations available by mixing a risk-free asset with a risky portfolio, illustrating efficient portfolio choices along the line. The Security Market Line (SML) depicts the expected return of individual securities as a function of their systematic risk, measured by beta, reflecting the market equilibrium under the Capital Asset Pricing Model (CAPM). Key differences include the CAL's focus on portfolio-level risk-return trade-offs involving risk-free assets, while the SML evaluates individual asset pricing relative to market risk, with the CAL slope indicating the Sharpe ratio and the SML slope representing the market risk premium.
Components and Calculation of CAL
The Capital Allocation Line (CAL) represents all possible combinations of a risk-free asset and a risky portfolio, illustrated by the equation CAL: E(R) = Rf + [(E(Rp) - Rf) / sp] * s, where Rf is the risk-free rate, E(Rp) is the expected return of the risky portfolio, sp is the standard deviation of the risky portfolio, and s is the total portfolio standard deviation. Its slope, known as the Sharpe Ratio, measures the risk-reward tradeoff of the risky portfolio relative to the risk-free asset. The Security Market Line (SML), derived from the Capital Asset Pricing Model (CAPM), plots expected return against systematic risk (beta), emphasizing individual asset risk pricing rather than mixed portfolio risk-return combinations on the CAL.
Components and Calculation of SML
The Capital Allocation Line (CAL) represents the risk-return combinations achievable by mixing a risk-free asset with a portfolio of risky assets, calculated using the formula \( E(R_C) = R_f + \frac{\sigma_C}{\sigma_P} (E(R_P) - R_f) \), where \( R_f \) is the risk-free rate, \( \sigma_C \) and \( \sigma_P \) are the standard deviations of the complete portfolio and risky portfolio respectively. The Security Market Line (SML) depicts the relationship between expected return and systematic risk (beta), calculated using \( E(R_i) = R_f + \beta_i (E(R_M) - R_f) \), where \( \beta_i \) measures an asset's sensitivity to market risk and \( E(R_M) \) is the expected market return. Unlike CAL which incorporates total risk (standard deviation), SML focuses solely on systematic risk via beta, emphasizing market equilibrium and asset pricing under the Capital Asset Pricing Model (CAPM).
Role of Risk and Return in CAL versus SML
The Capital Allocation Line (CAL) illustrates the trade-off between risk and return for efficient portfolios combining a risk-free asset and a risky portfolio, emphasizing total portfolio risk (standard deviation) in return expectations. The Security Market Line (SML) represents the relationship between expected return and systematic risk (beta) for individual assets within the Capital Asset Pricing Model (CAPM), highlighting that only market risk influences expected returns. While CAL measures total risk-return dynamics for diversified portfolios, SML focuses solely on non-diversifiable risk in pricing individual securities.
Graphical Representation: CAL vs SML
The Capital Allocation Line (CAL) represents combinations of a risk-free asset and a portfolio of risky assets, plotted with expected return on the y-axis and standard deviation (risk) on the x-axis forming a straight line starting from the risk-free rate. The Security Market Line (SML) illustrates the relationship between expected return and beta (systematic risk) of individual securities, appearing as an upward-sloping linear graph crossing the risk-free rate at beta zero. While CAL emphasizes total risk (standard deviation) and portfolio allocation, SML focuses on systematic risk and the pricing of individual securities according to the Capital Asset Pricing Model (CAPM).
Practical Applications for Investors
The Capital Allocation Line (CAL) helps investors determine the optimal mix of a risk-free asset and a portfolio of risky assets to maximize expected return for a given level of risk, guiding personalized portfolio construction. The Security Market Line (SML) represents the expected return of individual securities based on their systematic risk (beta), assisting investors in evaluating whether a stock is fairly priced relative to market risk. Practical application of CAL centers on portfolio diversification strategies, while the SML is crucial for asset pricing and identifying mispriced securities in equity markets.
Conclusion: Choosing Between CAL and SML
Choosing between the Capital Allocation Line (CAL) and the Security Market Line (SML) depends on the investment context and objectives. CAL illustrates the risk-return trade-off for portfolios combining a risk-free asset with a risky portfolio, emphasizing an investor's personal risk tolerance and optimal risky portfolio. SML represents the expected return of individual assets or portfolios as a function of systematic risk (beta), serving as a benchmark for assessing whether assets are fairly priced relative to market risk.
Capital Allocation Line Infographic