A liquid market allows you to quickly buy or sell assets without causing significant price changes, ensuring efficient trading and tight bid-ask spreads. High liquidity often indicates a healthy market with many participants, reducing the risk of price manipulation. Discover how understanding liquidity can enhance your investment strategy by reading the rest of this article.
Table of Comparison
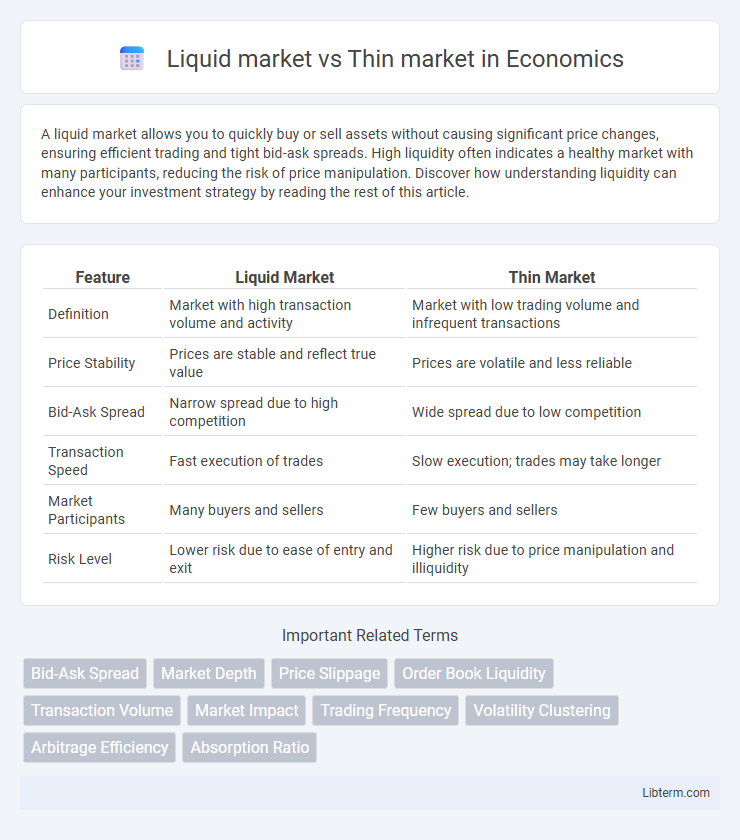
| Feature | Liquid Market | Thin Market |
|---|---|---|
| Definition | Market with high transaction volume and activity | Market with low trading volume and infrequent transactions |
| Price Stability | Prices are stable and reflect true value | Prices are volatile and less reliable |
| Bid-Ask Spread | Narrow spread due to high competition | Wide spread due to low competition |
| Transaction Speed | Fast execution of trades | Slow execution; trades may take longer |
| Market Participants | Many buyers and sellers | Few buyers and sellers |
| Risk Level | Lower risk due to ease of entry and exit | Higher risk due to price manipulation and illiquidity |
Understanding Liquid Markets
Liquid markets offer high trading volumes and tight bid-ask spreads, enabling investors to buy or sell assets quickly without significantly affecting prices. These markets feature numerous market participants and frequent transactions, which enhance price stability and reduce volatility. Understanding liquid markets helps investors execute large orders efficiently and capitalize on short-term price movements.
Defining Thin Markets
Thin markets are characterized by low trading volume and limited liquidity, resulting in wider bid-ask spreads and greater price volatility. Unlike liquid markets where assets can be bought or sold quickly with minimal price impact, thin markets often lack enough buyers and sellers to facilitate efficient transactions. This scarcity of market participants leads to less price transparency and increased risk for traders and investors.
Key Differences Between Liquid and Thin Markets
Liquid markets are characterized by high trading volumes and tight bid-ask spreads, enabling quick transactions with minimal price impact. Thin markets exhibit low trading volumes and wider bid-ask spreads, resulting in greater price volatility and slower trade execution. The key differences lie in liquidity levels, market depth, and transaction ease, affecting market efficiency and investor confidence.
Price Volatility in Liquid vs Thin Markets
Price volatility in liquid markets tends to be lower due to high trading volumes and tight bid-ask spreads, facilitating smoother price discovery and stable asset valuations. In contrast, thin markets experience higher price volatility as sparse trading activity and wider spreads amplify price fluctuations, often leading to inefficient pricing and increased risk. Market participants in thin markets face greater uncertainty and potential for abrupt price swings compared to more stable liquid markets.
Impact on Trading Volume
Liquid markets exhibit high trading volumes due to abundant buyers and sellers, facilitating swift order execution with minimal price impact. Thin markets have low trading volumes, causing larger bid-ask spreads and increased price volatility as trades significantly affect asset prices. The disparity in trading volume directly influences market efficiency and the ease with which traders can enter or exit positions.
Bid-Ask Spread Comparison
Liquid markets exhibit narrow bid-ask spreads due to high trading volumes and intense competition among buyers and sellers, enhancing price efficiency and reducing transaction costs. In contrast, thin markets have wider bid-ask spreads as fewer participants and lower liquidity increase price impact and execution risk. The bid-ask spread in a liquid market can be just a fraction of a cent, whereas in a thin market, it may expand dramatically, sometimes exceeding several percentage points of the asset's value.
Liquidity Risks and Their Consequences
Liquid markets exhibit high trading volumes and tight bid-ask spreads, reducing liquidity risks by enabling quick asset conversions without significant price impact. Thin markets suffer from low trading activity and wide spreads, increasing liquidity risks and causing delays or losses when attempting to sell assets. These liquidity challenges can lead to price volatility, market inefficiencies, and heightened financial instability during economic stress.
Market Participants and Their Roles
Liquid markets feature a high volume of market participants including institutional investors, retail traders, and market makers who provide continuous bid and ask quotes, enhancing price discovery and reducing spreads. Thin markets have fewer participants, often dominated by a limited number of buyers and sellers, leading to wider spreads and increased price volatility due to lower trading activity. Market makers in liquid markets actively facilitate trades to maintain liquidity, whereas in thin markets, their role diminishes, resulting in less efficient transaction execution.
Strategies for Trading in Thin Markets
Trading in thin markets requires strategies that prioritize minimizing price impact and managing lower liquidity risks. Traders often use limit orders to control execution prices and avoid slippage, while monitoring volume patterns closely to time entries and exits effectively. Risk management techniques such as position size reduction and diversification are essential to mitigate volatility inherent in thin markets.
Choosing the Right Market for Investment
Choosing the right market for investment hinges on understanding liquidity levels; liquid markets like major stock exchanges offer high trading volumes and ease of entry and exit, reducing transaction costs and price volatility. Thin markets, characterized by low trading volumes and limited participants, often present higher risks and wider bid-ask spreads but may offer unique opportunities for niche investments and less competition. Investors should balance liquidity preferences with risk tolerance and investment strategy to optimize returns in either liquid or thin markets.
Liquid market Infographic