The Soderberg diagram is a fundamental tool in fatigue analysis, used to assess the safe operating limits of materials under cyclic loading by combining mean and alternating stresses. It provides a conservative approach by plotting the allowable stress combinations to prevent fatigue failure, ensuring the reliability of mechanical components. Explore the rest of the article to learn how the Soderberg diagram can enhance your design process and improve material durability.
Table of Comparison
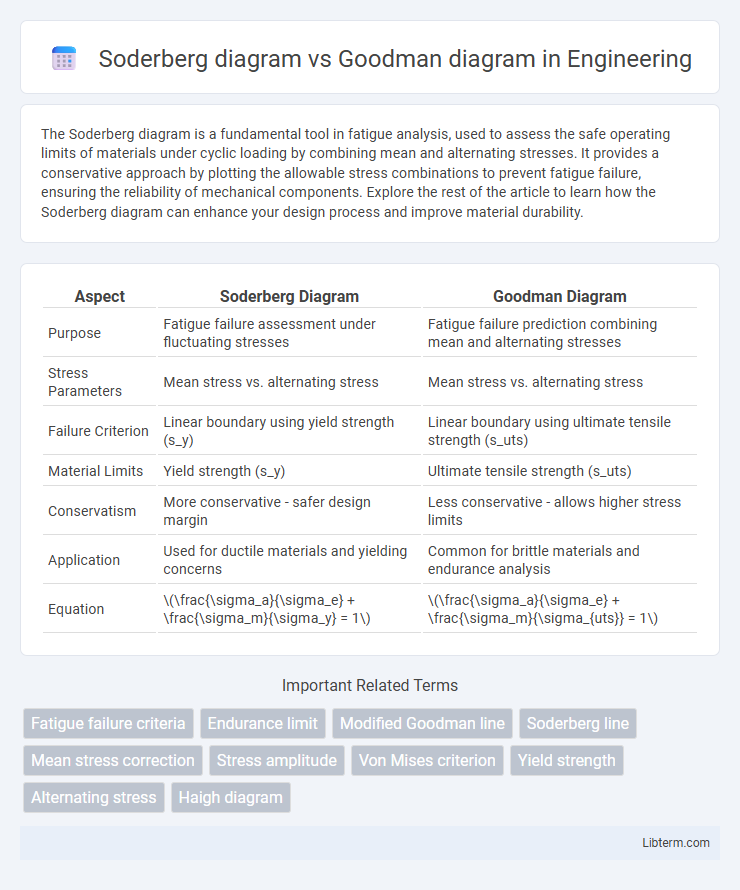
| Aspect | Soderberg Diagram | Goodman Diagram |
|---|---|---|
| Purpose | Fatigue failure assessment under fluctuating stresses | Fatigue failure prediction combining mean and alternating stresses |
| Stress Parameters | Mean stress vs. alternating stress | Mean stress vs. alternating stress |
| Failure Criterion | Linear boundary using yield strength (s_y) | Linear boundary using ultimate tensile strength (s_uts) |
| Material Limits | Yield strength (s_y) | Ultimate tensile strength (s_uts) |
| Conservatism | More conservative - safer design margin | Less conservative - allows higher stress limits |
| Application | Used for ductile materials and yielding concerns | Common for brittle materials and endurance analysis |
| Equation | \(\frac{\sigma_a}{\sigma_e} + \frac{\sigma_m}{\sigma_y} = 1\) | \(\frac{\sigma_a}{\sigma_e} + \frac{\sigma_m}{\sigma_{uts}} = 1\) |
Introduction to Fatigue Failure Analysis
Soderberg and Goodman diagrams are crucial tools in fatigue failure analysis used to predict the durability of materials under fluctuating stresses. The Soderberg diagram is a conservative approach, plotting mean stress against alternating stress to ensure designs stay within safe limits by considering yield strength. The Goodman diagram offers a more realistic assessment by relating mean stress and alternating stress to the ultimate tensile strength, enabling engineers to better estimate fatigue life under complex loading conditions.
Overview of Soderberg Diagram
The Soderberg diagram is a conservative failure criterion used in fatigue analysis that combines mean stress and alternating stress to predict fatigue life. It plots the alternating stress against mean stress, using the yield strength as a boundary to avoid plastic deformation, which differs from the Goodman diagram that uses ultimate tensile strength. The Soderberg line typically lies below the Goodman line, indicating a safer design margin by limiting mean stresses to below the material's yield strength.
Understanding the Goodman Diagram
The Goodman Diagram is a vital tool in fatigue analysis that illustrates the relationship between mean stress and alternating stress, enabling engineers to predict failure in materials under cyclic loading more accurately. Unlike the Soderberg Diagram, which uses yield strength as a limit, the Goodman Diagram employs ultimate tensile strength to define a more precise failure criterion for ductile materials. Understanding the Goodman Diagram enhances design safety by providing a clearer boundary between safe and failure regions under fluctuating stresses.
Key Assumptions and Theoretical Basis
The Soderberg diagram assumes a linear relationship between mean stress and alternating stress, focusing on a conservative yield strength criterion for fatigue failure under fluctuating loads. The Goodman diagram relies on a linear interpolation between ultimate tensile strength and fatigue limit, emphasizing the material's tensile failure threshold under cyclic loading. Both diagrams are grounded in stress-life (S-N) fatigue theory but differ in their treatment of mean stress effects and safety margins.
Comparison of Design Criteria
The Soderberg diagram emphasizes a conservative design criterion by combining mean stress and alternating stress against yield strength, ensuring safety by preventing both fatigue failure and yielding. The Goodman diagram uses ultimate tensile strength as a reference, allowing for higher mean stresses but with a less conservative margin, optimizing design for materials capable of enduring higher stress levels before failure. Engineers select between these criteria based on the balance between safety and material utilization, with Soderberg preferred for cautious designs and Goodman suitable for performance-driven applications.
Material Application Suitability
The Soderberg diagram emphasizes the relationship between mean stress and alternating stress, making it ideal for evaluating ductile materials with a clear yield point under cyclic loading. The Goodman diagram, which relates mean and alternating stress against ultimate tensile strength, is more suitable for brittle materials where failure occurs without significant plastic deformation. Selecting between the Soderberg and Goodman diagrams depends on the material's yield strength and ultimate tensile strength, ensuring accurate fatigue life predictions for specific material applications.
Safety Factors in Soderberg vs Goodman Approaches
The Soderberg diagram uses a conservative safety factor based on the yield strength, ensuring designs stay within elastic limits by combining mean and alternating stresses linearly. The Goodman diagram employs a more aggressive safety factor linked to ultimate tensile strength, allowing higher alternating stresses by accounting for failure mechanisms beyond yield point. Comparing safety factors, Soderberg offers higher margins against plastic deformation, while Goodman maximizes material utilization by balancing fatigue and static failure criteria.
Advantages and Limitations of Each Diagram
The Soderberg diagram offers a conservative approach by using yield strength as the limiting criterion, providing a safer design margin especially in ductile materials but often underestimates the allowable stress. The Goodman diagram incorporates ultimate tensile strength for failure prediction, allowing for a more realistic assessment of fatigue life in brittle materials but can be overly optimistic and lead to unsafe designs if yield strength is ignored. Each diagram balances safety and material utilization differently, with Soderberg favoring durability and Goodman optimizing performance under fluctuating loads.
Real-World Engineering Applications
The Soderberg diagram emphasizes safe operating limits by considering both mean and alternating stresses against yield strength, making it suitable for components where yielding precedes fatigue failure, such as in structural steel elements under fluctuating loads. The Goodman diagram, which plots mean versus alternating stress against ultimate tensile strength, is widely applied in mechanical design of rotating machinery and automotive parts where failure due to fatigue and fracture is critical. Engineers select the appropriate diagram based on material behavior and failure criteria, optimizing design for fatigue life in real-world scenarios like bridges, aircraft, and heavy machinery.
Conclusion: Choosing the Right Fatigue Diagram
The Soderberg diagram offers a conservative approach by using yield strength as a limiting factor, making it suitable for designs prioritizing safety in ductile materials. The Goodman diagram incorporates ultimate tensile strength, allowing for higher stress limits in less conservative applications where fatigue life is critical. Selecting the appropriate fatigue diagram depends on the material properties, safety requirements, and the nature of the cyclic loading conditions present in the engineering design.
Soderberg diagram Infographic