The adiabatic line represents a curve on a thermodynamic diagram where no heat exchange occurs between a system and its surroundings. This line is crucial for understanding processes in which the system's internal energy changes solely due to work done, such as in adiabatic expansions or compressions. Explore the rest of this article to delve deeper into how the adiabatic line impacts various thermodynamic applications and Your practical scenarios.
Table of Comparison
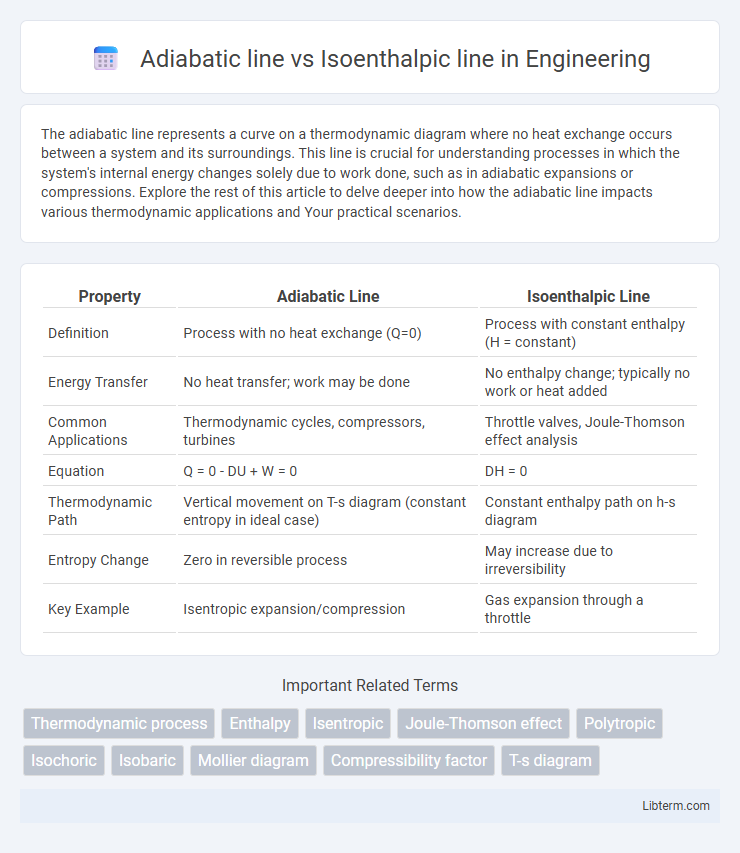
| Property | Adiabatic Line | Isoenthalpic Line |
|---|---|---|
| Definition | Process with no heat exchange (Q=0) | Process with constant enthalpy (H = constant) |
| Energy Transfer | No heat transfer; work may be done | No enthalpy change; typically no work or heat added |
| Common Applications | Thermodynamic cycles, compressors, turbines | Throttle valves, Joule-Thomson effect analysis |
| Equation | Q = 0 - DU + W = 0 | DH = 0 |
| Thermodynamic Path | Vertical movement on T-s diagram (constant entropy in ideal case) | Constant enthalpy path on h-s diagram |
| Entropy Change | Zero in reversible process | May increase due to irreversibility |
| Key Example | Isentropic expansion/compression | Gas expansion through a throttle |
Introduction to Adiabatic and Isoenthalpic Processes
Adiabatic processes occur without heat exchange with the surroundings, causing changes in a system's temperature and pressure solely due to internal energy variations. Isoenthalpic processes maintain constant enthalpy during expansion or throttling, commonly observed in Joule-Thomson throttling where temperature changes occur without heat transfer. Understanding these processes is essential in thermodynamics for analyzing energy transformations in engines, turbines, and refrigeration systems.
Defining the Adiabatic Line
The adiabatic line represents processes where no heat transfer occurs between a system and its surroundings, maintaining constant entropy throughout the change. It is defined by the relationship \( dQ = 0 \), ensuring all internal energy changes result from work done on or by the system. In thermodynamic diagrams, the adiabatic line differs from the isoenthalpic line, which holds constant enthalpy rather than entropy.
Understanding the Isoenthalpic Line
The isoenthalpic line represents processes where the enthalpy remains constant, essential for analyzing throttling devices and Joule-Thomson effects in thermodynamics. Unlike the adiabatic line, which denotes no heat exchange and typically involves changes in enthalpy, the isoenthalpic line keeps total enthalpy steady despite variations in pressure and temperature. Understanding isoenthalpic behavior is crucial for designing efficient refrigeration cycles, natural gas processing, and evaluating real gas expansions.
Key Thermodynamic Principles
The adiabatic line represents processes with no heat exchange where entropy may change, reflecting isentropic or non-isentropic behavior depending on reversibility. The isoenthalpic line, defined by constant enthalpy, typically characterizes throttling processes where temperature can vary despite unchanged total heat content. Key thermodynamic principles highlight that adiabatic processes conserve energy without heat transfer, while isoenthalpic processes conserve specific enthalpy, impacting temperature and phase changes during expansion or compression.
Differences in State Variables
The adiabatic line represents a process with no heat exchange, where entropy remains constant while temperature and pressure vary, reflecting changes in internal energy and enthalpy. The isoenthalpic line, however, depicts a process at constant enthalpy, allowing temperature and pressure to change independently, often observed in throttling processes. Key differences lie in the invariant state variables: entropy is constant along the adiabatic line, whereas enthalpy is constant along the isoenthalpic line, influencing how temperature and pressure respond during each process.
Visualization on Thermodynamic Diagrams
Adiabatic lines and isoenthalpic lines are crucial for interpreting thermodynamic diagrams such as T-s and P-v charts, where adiabatic lines represent processes with no heat exchange, maintaining constant entropy, while isoenthalpic lines indicate constant enthalpy processes with possible entropy changes. On a T-s diagram, adiabatic lines appear as vertical or near-vertical trajectories due to constant entropy, contrasting the often curved isoenthalpic lines reflecting energy transfer under constant enthalpy. Accurate visualization of these lines aids in analyzing thermodynamic cycles like turbines and throttling valves, enhancing understanding of energy conversion and efficiency in engineering systems.
Applications in Engineering and Science
Adiabatic lines represent processes with no heat exchange, critical for designing insulated systems like turbines and compressors where energy conservation is key. Isoenthalpic lines describe constant enthalpy conditions, essential in throttling devices such as valves and porous plugs used in refrigeration and HVAC systems to model pressure drops without heat transfer. Engineers and scientists use these lines to predict fluid behavior during expansions and compressions, ensuring efficient thermodynamic cycle designs and accurate performance analyses of heat engines and refrigeration cycles.
Real-world Examples: Adiabatic vs Isoenthalpic
Adiabatic lines represent processes with no heat exchange, commonly seen in ideal gas expansions within insulated systems like piston cylinders, where entropy remains constant. Isoenthalpic lines describe processes with constant enthalpy, crucial in throttling valves of refrigeration cycles where pressure drops without enthalpy change despite temperature variation. Understanding these lines helps optimize industrial applications such as gas pipelines (adiabatic cooling) and refrigeration throttling (isoenthalpic cooling).
Advantages and Limitations of Each Process
Adiabatic lines represent processes with no heat exchange, preserving entropy while allowing changes in temperature and pressure, which is advantageous for modeling ideal insulation conditions but limited by real-world heat losses. Isoenthalpic lines depict constant enthalpy processes ideal for throttling devices, offering simplified energy balance calculations but limited by the assumption of no work and heat transfer, which may not hold in all practical systems. Each process provides crucial insights for thermodynamic analysis, with adiabatic models excelling in insulation scenarios and isoenthalpic models suited for flow control and expansion applications.
Conclusion: Comparing Adiabatic and Isoenthalpic Lines
Adiabatic lines represent processes with no heat exchange and constant entropy, while isoenthalpic lines depict processes with constant enthalpy, often involving throttling or expansion without work interaction. Comparing these lines reveals that adiabatic processes are isentropic and reversible, making them ideal for thermodynamic efficiency analyses, whereas isoenthalpic processes are typically irreversible and used to model real-world throttling valves and Joule-Thomson cooling effects. Understanding the differences between adiabatic and isoenthalpic lines is crucial for accurate thermodynamic cycle calculations and optimizing energy systems.
Adiabatic line Infographic