Nyquist plot graphically represents the frequency response of a control system, illustrating stability and performance through complex plane plots of real and imaginary components of the system's transfer function. It is essential for analyzing gain and phase margins, crucial for designing robust feedback controls in engineering applications. Explore the rest of the article to understand how Nyquist plots can optimize your system's stability and performance.
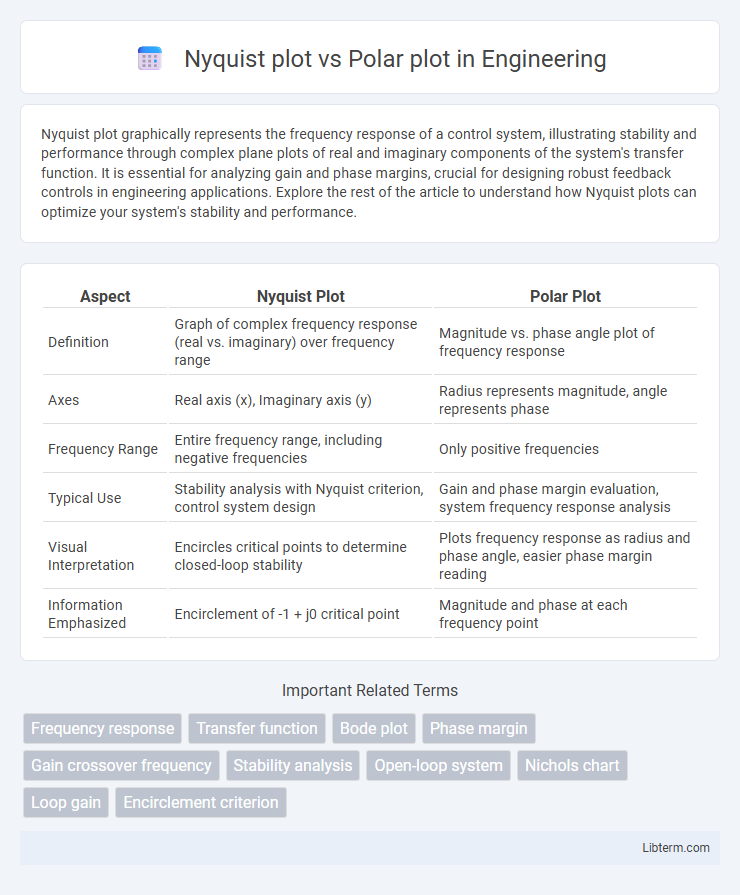
Table of Comparison
| Aspect | Nyquist Plot | Polar Plot |
|---|---|---|
| Definition | Graph of complex frequency response (real vs. imaginary) over frequency range | Magnitude vs. phase angle plot of frequency response |
| Axes | Real axis (x), Imaginary axis (y) | Radius represents magnitude, angle represents phase |
| Frequency Range | Entire frequency range, including negative frequencies | Only positive frequencies |
| Typical Use | Stability analysis with Nyquist criterion, control system design | Gain and phase margin evaluation, system frequency response analysis |
| Visual Interpretation | Encircles critical points to determine closed-loop stability | Plots frequency response as radius and phase angle, easier phase margin reading |
| Information Emphasized | Encirclement of -1 + j0 critical point | Magnitude and phase at each frequency point |
Introduction to Nyquist and Polar Plots
Nyquist plots graphically represent a system's frequency response by plotting the complex values of the open-loop transfer function in the complex plane, essential for stability analysis in control systems. Polar plots illustrate the magnitude and phase of a frequency response as a function of frequency, using a polar coordinate system to display gain and phase angle simultaneously. Both plots provide critical insights into system dynamics, but Nyquist plots emphasize closed-loop stability criteria, while polar plots highlight frequency-dependent gain and phase relationships.
Fundamentals of Frequency Response Analysis
Nyquist plots and polar plots both represent frequency response but differ fundamentally in their graphical representation; Nyquist plots display the complex frequency response on the complex plane with real and imaginary axes, capturing both magnitude and phase over frequency, while polar plots map the same response using magnitude as radius and phase as angle. Frequency response analysis relies on these plots to assess system stability and behavior by visualizing how the output signal's amplitude and phase vary with input frequency. Understanding the underlying mathematical relationship of transfer functions in the s-domain is crucial for interpreting these plots in control system design and signal processing contexts.
What is a Nyquist Plot?
A Nyquist plot represents the frequency response of a system by plotting the complex values of its transfer function as a parametric curve in the complex plane. It is primarily used in control engineering to assess system stability by encircling critical points like -1 in the complex plane. Unlike a polar plot that displays magnitude and phase separately with respect to frequency, the Nyquist plot integrates these into a single complex plot emphasizing gain and phase margins for stability analysis.
What is a Polar Plot?
A Polar Plot graphically represents complex functions by plotting the magnitude versus phase angle in a circular coordinate system, making it essential for analyzing frequency response in control systems and signal processing. It displays how the magnitude and phase of a transfer function change with frequency, often used to assess system stability and resonance. Unlike Nyquist plots, which trace a complex-valued function around the imaginary axis, Polar Plots focus specifically on the frequency-dependent amplitude and phase information in a single continuous curve.
Key Differences Between Nyquist and Polar Plots
Nyquist plots display frequency response by plotting complex impedance or transfer function values on the complex plane with frequency as an implicit parameter, often used to analyze system stability margins. Polar plots explicitly graph magnitude against phase angle at varying frequencies, providing intuitive insight into gain and phase relationships without directly showing real and imaginary components. The key difference lies in Nyquist plots representing both real and imaginary parts to assess stability and encirclement criteria, whereas polar plots emphasize magnitude-phase relations for resonance and bandwidth evaluation.
Applications in Control Systems Engineering
Nyquist plots are essential in control systems engineering for analyzing system stability and robustness by depicting frequency response data and enabling the identification of gain and phase margins, particularly in feedback control design. Polar plots provide a geometric view of system dynamics by representing complex function values over frequency, aiding in visualizing resonance and damping characteristics crucial in controller tuning. Both tools complement each other in frequency domain analysis, with Nyquist plots offering insights into closed-loop stability and polar plots facilitating intuitive understanding of open-loop frequency responses.
Advantages and Limitations of Nyquist Plots
Nyquist plots provide a comprehensive representation of system stability by displaying frequency response with real and imaginary components, enabling easy identification of gain and phase margins. Their advantages include clear visualization of closed-loop stability and the ability to handle systems with time delays and non-minimum phase behavior. Limitations arise from potential ambiguity in interpreting encirclements for systems with multiple poles on the imaginary axis and increased complexity when analyzing higher-order systems compared to simpler polar plots.
Advantages and Limitations of Polar Plots
Polar plots provide a clear visualization of frequency response by representing complex impedance or transfer functions in terms of magnitude and phase angle, making them intuitive for analyzing system stability and resonance. Their primary advantage lies in directly illustrating the phase relationship as a function of frequency, which simplifies the interpretation of gain and phase margins. Limitations include difficulties in interpreting overlapping curves at different frequencies and less straightforward stability assessment compared to Nyquist plots, which explicitly map encirclements of critical points in the complex plane.
Choosing Between Nyquist and Polar Plots
Nyquist plots provide comprehensive insight into system stability by displaying both gain and phase margins simultaneously, making them ideal for control system analysis. Polar plots, focusing primarily on the gain and phase relationship as a function of frequency, are useful for visualizing frequency response characteristics without directly indicating stability margins. Choosing between Nyquist and Polar plots depends on whether detailed stability information (Nyquist) or a simpler frequency response visualization (Polar) is required for system evaluation.
Summary and Practical Insights
Nyquist plots graph complex frequency response data by mapping real and imaginary components on Cartesian coordinates, commonly used for stability analysis in control systems. Polar plots represent magnitude and phase angle on a circular graph, offering intuitive visualization of system frequency response and resonance characteristics. Both plots are essential tools for engineers to diagnose system behavior, with Nyquist plots emphasizing feedback stability margins and Polar plots clarifying gain and phase relationships.
Nyquist plot Infographic