Basquin's law describes the relationship between stress amplitude and fatigue life in materials, indicating that higher stress levels result in shorter lifespans under cyclic loading. This empirical equation is fundamental in predicting the endurance limit and designing components to avoid fatigue failure. Discover how understanding Basquin's law can enhance Your engineering designs by reading the full article.
Table of Comparison
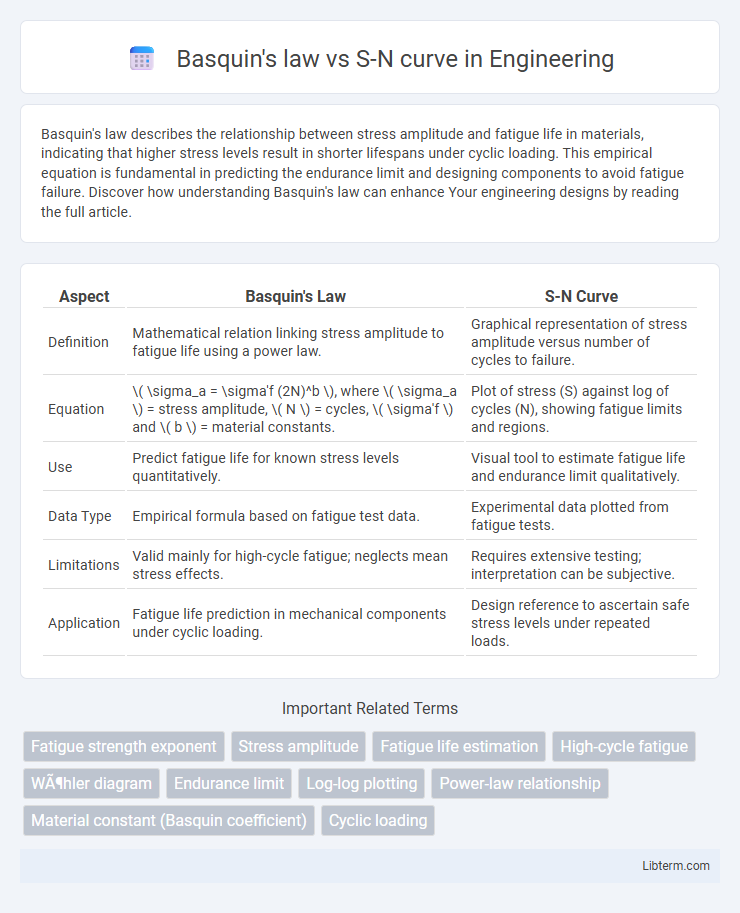
| Aspect | Basquin's Law | S-N Curve |
|---|---|---|
| Definition | Mathematical relation linking stress amplitude to fatigue life using a power law. | Graphical representation of stress amplitude versus number of cycles to failure. |
| Equation | \( \sigma_a = \sigma'f (2N)^b \), where \( \sigma_a \) = stress amplitude, \( N \) = cycles, \( \sigma'f \) and \( b \) = material constants. | Plot of stress (S) against log of cycles (N), showing fatigue limits and regions. |
| Use | Predict fatigue life for known stress levels quantitatively. | Visual tool to estimate fatigue life and endurance limit qualitatively. |
| Data Type | Empirical formula based on fatigue test data. | Experimental data plotted from fatigue tests. |
| Limitations | Valid mainly for high-cycle fatigue; neglects mean stress effects. | Requires extensive testing; interpretation can be subjective. |
| Application | Fatigue life prediction in mechanical components under cyclic loading. | Design reference to ascertain safe stress levels under repeated loads. |
Introduction to Fatigue Analysis
Basquin's law quantitatively describes the relationship between stress amplitude and fatigue life using a power-law equation, crucial for predicting fatigue failure in metals. The S-N curve graphically represents this relationship by plotting stress (S) against the number of cycles to failure (N), serving as a fundamental tool in fatigue analysis. Understanding both concepts enables engineers to estimate material durability under cyclic loading and design components with improved fatigue resistance.
Understanding Basquin's Law
Basquin's law expresses the relationship between stress amplitude and fatigue life in materials subjected to high-cycle fatigue, typically formulated as \( \sigma_a = \sigma_f' (2N)^b \), where \( \sigma_a \) is the stress amplitude, \( N \) is the number of cycles to failure, \( \sigma_f' \) is the fatigue strength coefficient, and \( b \) is the fatigue strength exponent. Unlike the S-N curve, which graphically represents the empirical relationship between stress and cycles to failure for a material, Basquin's law provides a mathematical model capturing the linear portion of the S-N curve on a log-log scale. Understanding Basquin's law enhances fatigue analysis by enabling precise quantification of fatigue life under cyclic loading, critical in mechanical design and structural integrity assessments.
Basics of the S-N Curve
The S-N curve, also known as the Wohler curve, graphically represents the relationship between cyclic stress amplitude and the number of cycles to failure for a material, providing essential fatigue life data. Unlike Basquin's law, which is a mathematical model describing the high-cycle fatigue regime with a power-law relationship between stress and life, the S-N curve offers empirical fatigue limits and endurance characteristics derived from experimental testing. Understanding the basics of the S-N curve is crucial for designing components to withstand expected fatigue loads by identifying stress levels that lead to infinite life or failure after a specific number of cycles.
Mathematical Formulations: Basquin vs S-N
Basquin's law mathematically expresses fatigue life as a power-law relationship between stress amplitude and number of cycles to failure, typically written as s_a = s_f' (2N)^b, where s_a is stress amplitude, s_f' is fatigue strength coefficient, N is number of cycles, and b is fatigue strength exponent. In contrast, the S-N curve represents empirical data points plotting stress (S) against the number of cycles to failure (N) on a logarithmic scale without a fixed analytical formula, providing a visual fatigue limit or endurance limit. Basquin's law offers a precise functional model for the high-cycle fatigue regime, while S-N curves provide broader experimental fatigue life characterization across multiple stress levels.
Material Behavior and Fatigue Life Prediction
Basquin's law describes the relationship between stress amplitude and fatigue life using a power-law equation, emphasizing elastic strain behavior under high-cycle fatigue conditions. The S-N curve represents experimental data plotting stress (S) versus the number of cycles to failure (N), capturing the material's overall fatigue response including microstructural effects and cyclic hardening or softening. Basquin's law provides a mathematical framework for fatigue life prediction in the high-cycle regime, while S-N curves offer empirical insights across a broader range of fatigue behaviors.
Practical Applications in Engineering
Basquin's law offers precise fatigue life predictions for high-cycle fatigue scenarios by relating stress amplitude to the number of cycles to failure, making it essential for designing components subjected to fluctuating loads such as springs and aircraft wings. The S-N curve, or Wohler curve, provides empirical fatigue data across a range of materials and serves as a practical reference for engineers in structural design, allowing for safe life assessments in bridges, automotive parts, and pressure vessels. Applying Basquin's law alongside S-N curves enables engineers to optimize materials and geometries for fatigue resistance, improving reliability and lifespan in mechanical and civil engineering applications.
Advantages and Limitations of Basquin's Law
Basquin's law offers a straightforward mathematical relationship between stress amplitude and fatigue life, making it highly useful for predicting high-cycle fatigue in metallic materials with minimal experimental data. Its primary advantage lies in its simplicity and ability to model the power-law behavior of fatigue, enabling engineers to estimate fatigue life efficiently. However, Basquin's law is limited by its reliance on linear assumptions and does not accurately capture low-cycle fatigue behavior or material-specific complexities represented by the more comprehensive S-N curve.
Interpreting the S-N Curve in Practice
Basquin's law mathematically models the high-cycle fatigue behavior by relating stress amplitude to fatigue life through a power-law equation, serving as a theoretical foundation for the S-N curve. The S-N curve plots stress amplitude versus the number of cycles to failure, providing a practical graphical tool for engineers to predict fatigue life under variable loading conditions. Interpreting the S-N curve involves recognizing the fatigue limit, understanding the transition between low-cycle and high-cycle fatigue, and applying empirical data to anticipate material performance in real-world fatigue scenarios.
Comparative Analysis: Basquin's Law and S-N Curve
Basquin's law models fatigue life through a power-law relationship between stress amplitude and the number of cycles to failure, emphasizing high-cycle fatigue behavior with a clear mathematical formulation. The S-N curve, derived from experimental data, plots stress (S) versus the number of cycles to failure (N), capturing a broader fatigue response including both low- and high-cycle fatigue regimes with material-specific variability. Comparative analysis reveals Basquin's law provides a simplified, predictive model focused on the elastic stress range, while the S-N curve offers empirical versatility by incorporating complex fatigue phenomena such as variable amplitude loading and endurance limits.
Conclusion and Future Perspectives
Basquin's law provides a mathematical framework describing the relationship between stress amplitude and fatigue life, emphasizing a power-law behavior in high-cycle fatigue regimes, while the S-N curve represents empirical fatigue data showing material response under cyclic loading. Future research aims to refine these models by integrating microstructural factors and multiaxial stress states to improve accuracy in fatigue life prediction. Advances in computational materials science and machine learning are expected to enhance the predictive capability for diverse materials and complex loading conditions.
Basquin's law Infographic