A flowchart visually represents a process or workflow, using symbols like arrows, rectangles, and diamonds to illustrate steps and decision points clearly. It simplifies complex procedures, making it easier for Your team to understand and follow sequential tasks. Explore the rest of this article to master how flowcharts can enhance your project management and problem-solving skills.
Table of Comparison
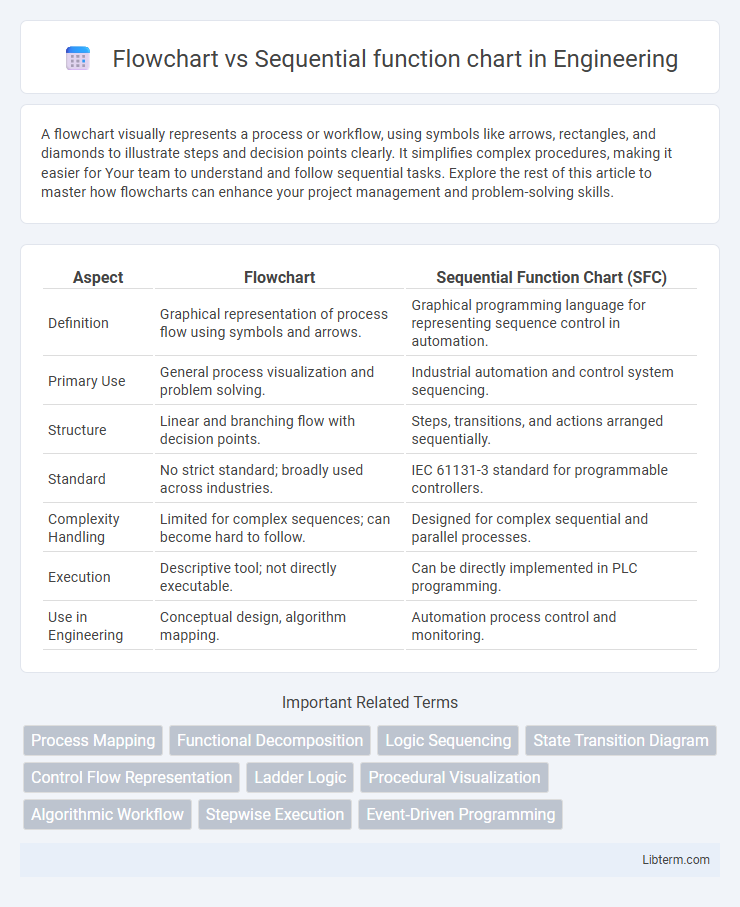
| Aspect | Flowchart | Sequential Function Chart (SFC) |
|---|---|---|
| Definition | Graphical representation of process flow using symbols and arrows. | Graphical programming language for representing sequence control in automation. |
| Primary Use | General process visualization and problem solving. | Industrial automation and control system sequencing. |
| Structure | Linear and branching flow with decision points. | Steps, transitions, and actions arranged sequentially. |
| Standard | No strict standard; broadly used across industries. | IEC 61131-3 standard for programmable controllers. |
| Complexity Handling | Limited for complex sequences; can become hard to follow. | Designed for complex sequential and parallel processes. |
| Execution | Descriptive tool; not directly executable. | Can be directly implemented in PLC programming. |
| Use in Engineering | Conceptual design, algorithm mapping. | Automation process control and monitoring. |
Introduction to Flowcharts and Sequential Function Charts
Flowcharts visually represent the step-by-step flow of processes using symbols like arrows, rectangles, and diamonds to illustrate decision points and actions, aiding in clear process understanding and communication. Sequential Function Charts (SFCs) extend flowcharts by organizing complex control sequences into steps, transitions, and actions, commonly used in programmable logic controller (PLC) programming for industrial automation. Both tools serve to simplify and document process logic, but SFCs specifically provide structured control over sequence execution, enhancing clarity in automated system workflows.
Key Differences Between Flowcharts and SFCs
Flowcharts visually represent step-by-step processes using symbols like arrows and shapes, emphasizing the flow of control in various applications, such as programming and process design. Sequential Function Charts (SFCs) specifically model discrete control systems with defined steps, transitions, and actions, commonly used in programmable logic controllers (PLCs) for industrial automation. Key differences include SFCs' ability to handle concurrent activities and explicit state transitions, whereas flowcharts primarily depict linear or branching workflows without formal execution semantics.
Core Components of Flowcharts
Flowcharts consist of core components such as process symbols representing tasks, decision symbols indicating branching points, and arrows depicting the flow of control between steps. Each symbol corresponds to a specific action or decision, enabling intuitive visualization of a process's sequence and logic. In contrast, Sequential Function Charts (SFC) emphasize steps, transitions, and actions in automation systems, focusing on state-based progression rather than general process flow.
Fundamental Elements of Sequential Function Charts
Sequential Function Charts (SFC) consist of fundamental elements such as steps, transitions, and actions that control the sequence of operations in automation processes. Steps represent distinct states or conditions, transitions act as conditional triggers based on logical expressions, and actions execute specific operations or outputs when steps are active. This structured approach in SFC enables clear visualization and control of complex sequential behaviors compared to traditional flowcharts, which are typically more linear and less modular.
Applications in Industrial Automation
Flowcharts provide a versatile visual representation of process logic, widely used in industrial automation for simple process mapping and troubleshooting of sequential operations. Sequential Function Charts (SFC) are specifically designed for programmable logic controllers (PLCs), enabling structured control of complex automation sequences with defined steps and transitions. SFCs excel in applications requiring precise timing and synchronization, such as assembly line automation and batch processing systems.
Advantages of Flowcharts
Flowcharts provide a clear and intuitive visualization of processes through simple symbols and arrows, making complex workflows easier to understand and communicate. Their flexibility allows for quick modifications and adaptability to various fields, from software development to business operations. Flowcharts enhance problem-solving by highlighting decision points and process paths, facilitating efficient analysis and optimization.
Benefits of Using Sequential Function Charts
Sequential Function Charts (SFC) enhance the clarity and organization of complex control processes by visually representing sequence steps and transitions, making it easier to design, analyze, and troubleshoot automation systems. SFCs provide modular and hierarchical structuring, enabling reusable and maintainable code blocks that improve system scalability and reduce programming errors. Their support for parallel execution and synchronized operations offers superior control over concurrent processes compared to traditional flowcharts, optimizing workflow efficiency in industrial automation.
Limitations and Challenges
Flowcharts often struggle with complexity and scalability when representing large or intricate processes, leading to difficulty in maintenance and understanding. Sequential Function Charts (SFC) face challenges in flexibility, as their rigid step and transition structure may limit dynamic process adaptations. Both tools may encounter integration issues in modern automated systems due to differing standards and compatibility constraints.
Choosing the Right Tool: Flowchart vs SFC
Flowcharts provide a visual representation of processes through symbols and arrows, ideal for simple, linear workflows requiring clarity and ease of understanding. Sequential Function Charts (SFC) excel in complex automation tasks by breaking down operations into steps and transitions, supporting parallel processes and synchronization. Selecting between flowcharts and SFC depends on process complexity, with flowcharts suited for straightforward sequences and SFC preferred for detailed control systems like programmable logic controllers (PLCs).
Conclusion and Best Practices
Flowcharts excel in visualizing simple, linear processes with clear decision points, while Sequential Function Charts (SFC) provide structured control in complex automation tasks by representing simultaneous and sequential operations. Best practices recommend using flowcharts for straightforward workflows and employing SFCs in industrial automation systems to enhance clarity, modularity, and maintainability of control logic. Combining both methods can optimize process design by leveraging flowchart simplicity and SFC precision in appropriate stages.
Flowchart Infographic