False positive rate measures the proportion of incorrect positive results among all negative cases, indicating how often a test falsely signals a condition. Minimizing this rate is crucial for improving diagnostic accuracy and avoiding unnecessary treatments or actions. Discover how understanding false positive rate impacts your decision-making in the full article.
Table of Comparison
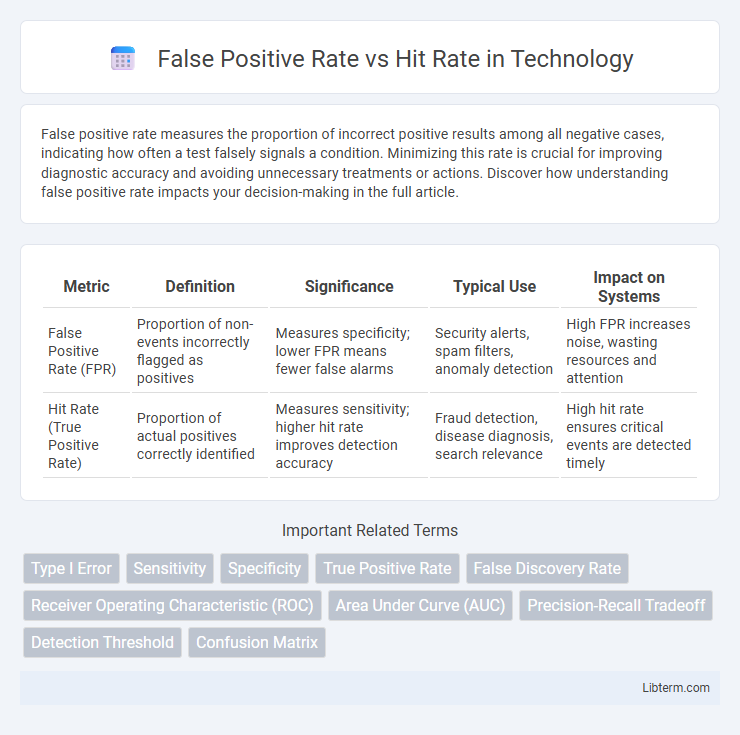
| Metric | Definition | Significance | Typical Use | Impact on Systems |
|---|---|---|---|---|
| False Positive Rate (FPR) | Proportion of non-events incorrectly flagged as positives | Measures specificity; lower FPR means fewer false alarms | Security alerts, spam filters, anomaly detection | High FPR increases noise, wasting resources and attention |
| Hit Rate (True Positive Rate) | Proportion of actual positives correctly identified | Measures sensitivity; higher hit rate improves detection accuracy | Fraud detection, disease diagnosis, search relevance | High hit rate ensures critical events are detected timely |
Understanding False Positive Rate and Hit Rate
False Positive Rate (FPR) measures the proportion of negative instances incorrectly classified as positive, indicating the likelihood of false alarms in a system. Hit Rate, also known as True Positive Rate (TPR) or sensitivity, quantifies the proportion of actual positives correctly identified by the model, reflecting its detection capability. Understanding the balance between FPR and Hit Rate is crucial for optimizing model performance in applications such as fraud detection, medical diagnosis, and spam filtering.
Key Definitions: False Positives and Hits
False Positive Rate measures the proportion of negative instances incorrectly classified as positive, indicating the frequency of false alarms in a detection system. Hit Rate, also known as True Positive Rate or Sensitivity, represents the proportion of actual positives correctly identified by the system. Understanding these key definitions is essential for evaluating the accuracy and reliability of classifiers in binary classification tasks.
The Role of False Positive Rate in Data Analysis
The False Positive Rate (FPR) quantifies the proportion of negative instances incorrectly classified as positive, playing a critical role in evaluating model accuracy and reliability in data analysis. Monitoring FPR helps balance sensitivity and specificity, ensuring models do not generate excessive false alarms that can lead to resource wastage or misleading conclusions. Optimizing FPR alongside the Hit Rate enables more precise decision-making, improving the overall effectiveness of predictive analytics and classification systems.
Explaining Hit Rate in Performance Metrics
Hit Rate, also known as True Positive Rate or Sensitivity, measures the proportion of actual positives correctly identified by a model and is calculated as the ratio of true positives to the sum of true positives and false negatives. It is a critical performance metric in classification tasks, indicating how effectively a model detects positive instances. High hit rate ensures that most relevant cases are captured, which is particularly important in applications like medical diagnosis, fraud detection, and information retrieval.
Mathematical Formulas: False Positive Rate vs Hit Rate
False Positive Rate (FPR) is calculated as the ratio of false positives to the total number of actual negatives, expressed mathematically as FPR = FP / (FP + TN). Hit Rate, also known as True Positive Rate (TPR) or sensitivity, measures the proportion of correctly identified positives, defined as TPR = TP / (TP + FN). These formulas are essential in evaluating classification models by balancing the trade-off between detecting positive instances and minimizing false alarms.
Real-World Examples Comparing Both Rates
In cybersecurity, the false positive rate (FPR) measures the proportion of benign activities incorrectly flagged as threats, while the hit rate (true positive rate) reflects the system's ability to correctly identify actual attacks. For example, email spam filters balancing a low FPR minimize legitimate emails marked as spam, whereas a high hit rate ensures most malicious emails get caught. In fraud detection systems, a low false positive rate prevents unnecessary account freezes, and a high hit rate detects genuine fraudulent transactions effectively.
Factors Influencing False Positive and Hit Rates
False positive rate and hit rate are influenced by factors such as threshold settings, model complexity, and data quality. Adjusting the decision threshold impacts the trade-off between detecting true positives and minimizing false alarms. Noise in data and class imbalance also contribute significantly to variations in both false positive and hit rates.
Impact on Decision Making and Model Evaluation
False Positive Rate (FPR) and Hit Rate (also known as True Positive Rate or Sensitivity) critically influence decision-making by balancing error types in model evaluations. High FPR can lead to unnecessary actions based on incorrect alarms, impacting resource allocation and user trust, while a high Hit Rate ensures that most positive cases are correctly identified, enhancing the model's effectiveness in critical applications like medical diagnosis or fraud detection. Evaluating both metrics together provides a comprehensive understanding of model performance, guiding threshold adjustments to optimize precision and recall for specific operational contexts.
Strategies to Balance and Optimize Both Rates
Balancing false positive rate and hit rate requires implementing adaptive thresholding techniques that adjust decision boundaries based on real-time data distribution to minimize misclassification. Leveraging machine learning models with cost-sensitive algorithms optimizes performance by weighting false positives and false negatives differently according to specific application priorities. Regular model evaluation using precision-recall curves and ROC analysis helps fine-tune parameters, ensuring an optimal trade-off between sensitivity and specificity in diverse operational contexts.
Best Practices for Reporting and Interpreting Results
To report and interpret False Positive Rate (FPR) vs Hit Rate effectively, always present these metrics alongside context-specific thresholds that reflect the acceptable trade-offs between sensitivity and specificity in your domain. Use receiver operating characteristic (ROC) curves to visualize the balance between true positive and false positive rates, highlighting the area under the curve (AUC) as a quantitative measure of model performance. Complement these with precision-recall summaries when dealing with imbalanced datasets to ensure comprehensive evaluation and actionable insights.
False Positive Rate Infographic