Standard deviation measures the amount of variation or dispersion in a data set, indicating how spread out the values are from the mean. A low standard deviation means data points are close to the average, while a high value signifies greater variability, impacting the reliability of your analysis. Explore the full article to understand how standard deviation influences data interpretation and decision-making.
Table of Comparison
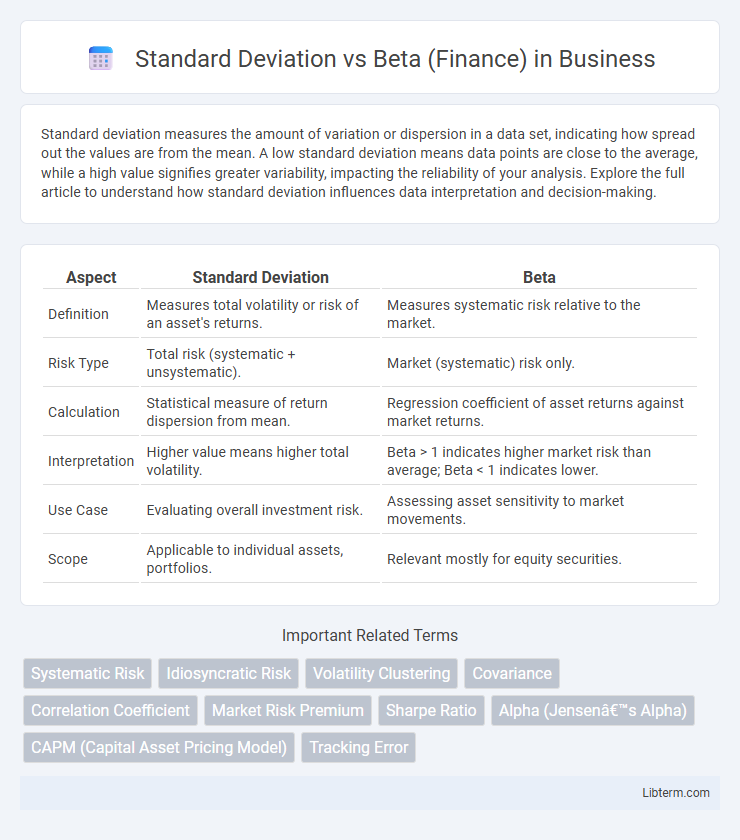
| Aspect | Standard Deviation | Beta |
|---|---|---|
| Definition | Measures total volatility or risk of an asset's returns. | Measures systematic risk relative to the market. |
| Risk Type | Total risk (systematic + unsystematic). | Market (systematic) risk only. |
| Calculation | Statistical measure of return dispersion from mean. | Regression coefficient of asset returns against market returns. |
| Interpretation | Higher value means higher total volatility. | Beta > 1 indicates higher market risk than average; Beta < 1 indicates lower. |
| Use Case | Evaluating overall investment risk. | Assessing asset sensitivity to market movements. |
| Scope | Applicable to individual assets, portfolios. | Relevant mostly for equity securities. |
Understanding Standard Deviation in Finance
Standard deviation in finance measures the total volatility or risk of an asset's returns by quantifying the dispersion from its average return, offering insight into the asset's price stability. Unlike beta, which gauges an asset's sensitivity to market movements and systematic risk, standard deviation captures both systematic and unsystematic risk components affecting overall investment volatility. Investors rely on standard deviation to assess the potential range of returns and to construct diversified portfolios that minimize total risk exposure.
Defining Beta in Financial Analysis
Beta in financial analysis quantifies an asset's sensitivity to market movements, representing its systematic risk relative to the overall market index. Unlike standard deviation, which measures total volatility including both systematic and unsystematic risk, beta isolates market-related risk by comparing historical returns of the asset to those of a benchmark, such as the S&P 500. A beta greater than 1 indicates higher market risk, while a beta less than 1 signifies lower sensitivity to market fluctuations.
Measuring Risk: Standard Deviation vs Beta
Standard deviation quantifies total volatility by measuring the dispersion of an asset's returns around its mean, reflecting both systematic and unsystematic risk. Beta evaluates systematic risk by comparing an asset's sensitivity to market movements, indicating how much the asset's returns move relative to the overall market index. Investors use standard deviation to assess overall risk magnitude, while beta helps determine an asset's contribution to portfolio risk through market correlation.
How Standard Deviation Reflects Total Volatility
Standard deviation measures the total volatility of an asset by quantifying the dispersion of its returns around the mean, capturing both systematic and unsystematic risks. Unlike beta, which isolates an asset's sensitivity to market movements, standard deviation reflects the complete range of fluctuations an investor might experience. This comprehensive volatility metric aids in assessing the overall risk exposure of a portfolio, making it a crucial tool in risk management and investment decisions.
Beta as a Measure of Systematic Risk
Beta measures systematic risk by quantifying a stock's sensitivity to market movements, reflecting how much its returns move relative to the overall market. Unlike standard deviation, which captures total volatility including both systematic and unsystematic risks, beta isolates the market-related risk that cannot be diversified away. Investors use beta to assess how a security's price is expected to respond to market changes, making it crucial for portfolio risk management and asset pricing models like the Capital Asset Pricing Model (CAPM).
Calculation Methods for Standard Deviation and Beta
Standard deviation in finance is calculated by measuring the square root of the variance, which involves determining the average squared deviations from the mean return of a security or portfolio over a specific period. Beta is calculated through regression analysis by comparing the covariance of a security's returns with the returns of a benchmark index, typically the market portfolio, divided by the variance of the benchmark's returns. While standard deviation quantifies total risk by assessing volatility, beta captures systematic risk by indicating the sensitivity of a security's returns relative to market movements.
Pros and Cons of Using Standard Deviation
Standard deviation measures the total volatility of an asset's returns, capturing both systematic and unsystematic risk, making it useful for assessing overall investment risk but less effective in isolating market-related fluctuations. Its advantage lies in simplicity and applicability to any asset class, while its main drawback is that it does not differentiate between diversifiable risk and market risk, potentially overstating the risk for well-diversified portfolios. Unlike beta, which focuses on relative market risk and is essential for Capital Asset Pricing Model (CAPM) calculations, standard deviation can mislead investors about true market-related risk exposure.
Pros and Cons of Using Beta
Beta measures a stock's volatility relative to the overall market, providing investors with insights into systematic risk and portfolio diversification benefits. Its pros include helping to assess market-related risk and informing asset allocation strategies, while cons involve its reliance on historical data that may not predict future performance and its inability to capture idiosyncratic risk. Unlike standard deviation, which quantifies total volatility, beta focuses solely on market-related movements, making it less comprehensive but more targeted for market risk evaluation.
When to Use Standard Deviation vs Beta
Standard deviation measures the total volatility of an asset's returns, making it ideal for assessing overall risk in individual stocks or portfolios without considering market movements. Beta evaluates systematic risk by comparing an asset's price fluctuations relative to a benchmark index, crucial for understanding market-related risk exposure and portfolio diversification. Use standard deviation when analyzing total return variability and beta when evaluating sensitivity to market fluctuations or constructing a market-aligned investment strategy.
Practical Examples: Standard Deviation and Beta in Portfolio Management
Standard deviation measures the total risk or volatility of a portfolio's returns, indicating how much returns can deviate from the average, while beta quantifies the portfolio's sensitivity to overall market movements, reflecting systematic risk. For example, a portfolio with a standard deviation of 12% shows moderate volatility, while a beta of 1.2 suggests the portfolio is 20% more volatile than the market, making it riskier during market upswings and downturns. Portfolio managers use standard deviation to assess absolute risk and beta to evaluate market-related risk, optimizing asset allocation based on investors' risk tolerance and market exposure preferences.
Standard Deviation Infographic