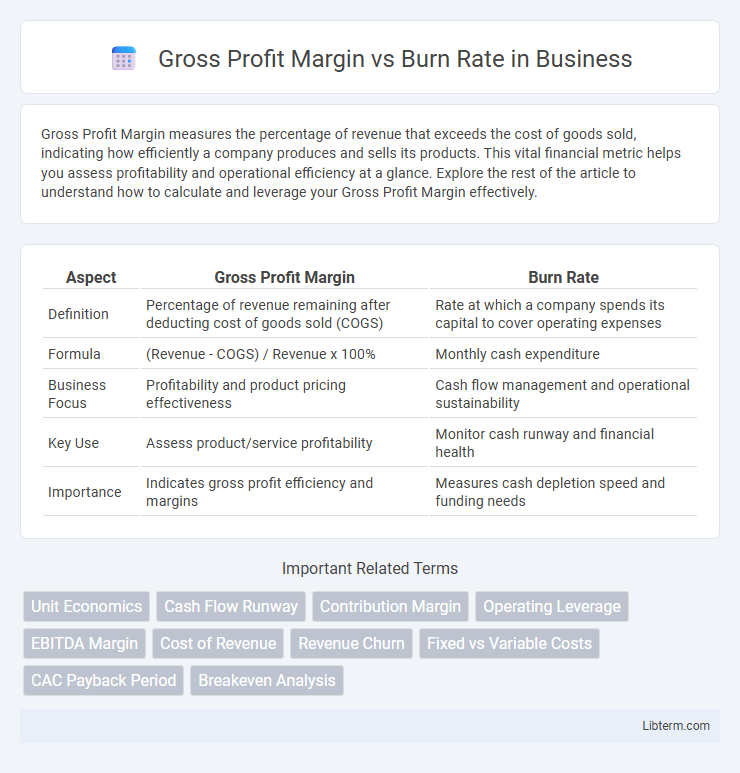
Gross Profit Margin measures the percentage of revenue that exceeds the cost of goods sold, indicating how efficiently a company produces and sells its products. This vital financial metric helps you assess profitability and operational efficiency at a glance. Explore the rest of the article to understand how to calculate and leverage your Gross Profit Margin effectively.
Table of Comparison
| Aspect | Gross Profit Margin | Burn Rate |
|---|---|---|
| Definition | Percentage of revenue remaining after deducting cost of goods sold (COGS) | Rate at which a company spends its capital to cover operating expenses |
| Formula | (Revenue - COGS) / Revenue x 100% | Monthly cash expenditure |
| Business Focus | Profitability and product pricing effectiveness | Cash flow management and operational sustainability |
| Key Use | Assess product/service profitability | Monitor cash runway and financial health |
| Importance | Indicates gross profit efficiency and margins | Measures cash depletion speed and funding needs |
Understanding Gross Profit Margin
Gross Profit Margin measures the percentage of revenue remaining after deducting the cost of goods sold, indicating the efficiency of production and pricing strategies. A high Gross Profit Margin signifies strong profitability on sales, essential for sustaining operations without excessive reliance on external funding. Monitoring Gross Profit Margin provides critical insights into financial health, guiding decision-making to optimize costs and improve overall business performance relative to the burn rate.
What Is Burn Rate?
Burn rate refers to the speed at which a company spends its available capital, typically measured monthly, indicating how quickly cash reserves are depleted during operations. It is a critical financial metric for startups and businesses relying on external funding to assess runway and sustainability before reaching profitability. Understanding burn rate helps investors and management monitor cash flow health and make strategic decisions to extend operational lifespan.
Key Differences Between Gross Profit Margin and Burn Rate
Gross Profit Margin measures a company's financial health by indicating the percentage of revenue exceeding the cost of goods sold, reflecting profitability from core operations. Burn Rate quantifies the speed at which a company uses its cash reserves, crucial for startups to manage runway and avoid insolvency. While Gross Profit Margin highlights operational efficiency, Burn Rate focuses on cash flow sustainability and expense management.
Importance of Gross Profit Margin in Business Performance
Gross Profit Margin is a critical indicator of a company's financial health, revealing how efficiently it produces goods or services relative to sales revenue. High gross profit margins enable businesses to cover operational expenses, invest in growth, and withstand periods of high Burn Rate without jeopardizing sustainability. Monitoring Gross Profit Margin supports strategic decisions that enhance profitability and long-term business performance.
Why Monitoring Burn Rate Matters
Monitoring burn rate is critical for startups and growing companies as it directly impacts their runway--the time a company can operate before needing additional funding. Unlike gross profit margin, which measures profitability from core operations, burn rate tracks cash outflow, revealing how quickly a company is depleting its capital. Keeping burn rate in check ensures sustainable growth and helps prevent unexpected liquidity crises that could jeopardize business continuity.
How Gross Profit Margin Influences Cash Flow
Gross Profit Margin directly impacts cash flow by indicating the percentage of revenue remaining after deducting the cost of goods sold, thus reflecting operational efficiency. Higher gross profit margins generate more cash internally, enabling businesses to cover burn rate expenses and invest in growth without immediate external financing. Conversely, low gross profit margins can strain cash flow, increasing dependency on external capital to sustain operations and manage burn rate.
Burn Rate’s Impact on Startup Survival
Burn rate measures the cash a startup spends monthly, directly influencing how long it can operate before needing additional funding. While gross profit margin highlights profitability from sales, burn rate determines runway longevity, making it critical for early-stage startups with limited revenue streams. Effectively managing burn rate extends operational lifespan, allowing more time to achieve product-market fit and secure sustainable revenue.
Calculating Gross Profit Margin: Step-by-Step
Calculating gross profit margin involves subtracting the cost of goods sold (COGS) from total revenue, then dividing the result by total revenue, and multiplying by 100 to express it as a percentage. This metric reveals the percentage of revenue remaining after covering production costs, crucial for assessing business profitability. Comparing gross profit margin with burn rate helps determine how efficiently a company generates profit relative to its cash expenditure.
Managing Burn Rate for Financial Sustainability
Managing burn rate effectively ensures a startup maintains sufficient cash flow while scaling operations, directly impacting financial sustainability. Monitoring gross profit margin helps identify profitability trends, guiding cost control measures to reduce burn rate. By aligning burn rate with gross profit margin, companies can extend runway and optimize resource allocation for long-term growth.
Strategies to Improve Gross Profit Margin and Lower Burn Rate
Enhancing gross profit margin involves strategies such as increasing product pricing, reducing cost of goods sold (COGS) through supplier negotiation, and optimizing production efficiency. Lowering burn rate requires rigorous expense management, prioritizing cash flow-positive activities, and implementing lean operational practices to minimize unnecessary overhead. Combining these approaches drives sustainable profitability by maximizing revenue retention while controlling cash outflows.
Gross Profit Margin Infographic

 libterm.com