EPS (Earnings Per Share) measures a company's profitability on a per-share basis, reflecting net income allocated to each outstanding share. DPS (Dividends Per Share) indicates the amount of dividends paid to shareholders for each share they own, highlighting the company's dividend policy and cash flow distribution. Explore the article to understand how these metrics impact Your investment decisions and financial analysis.
Table of Comparison
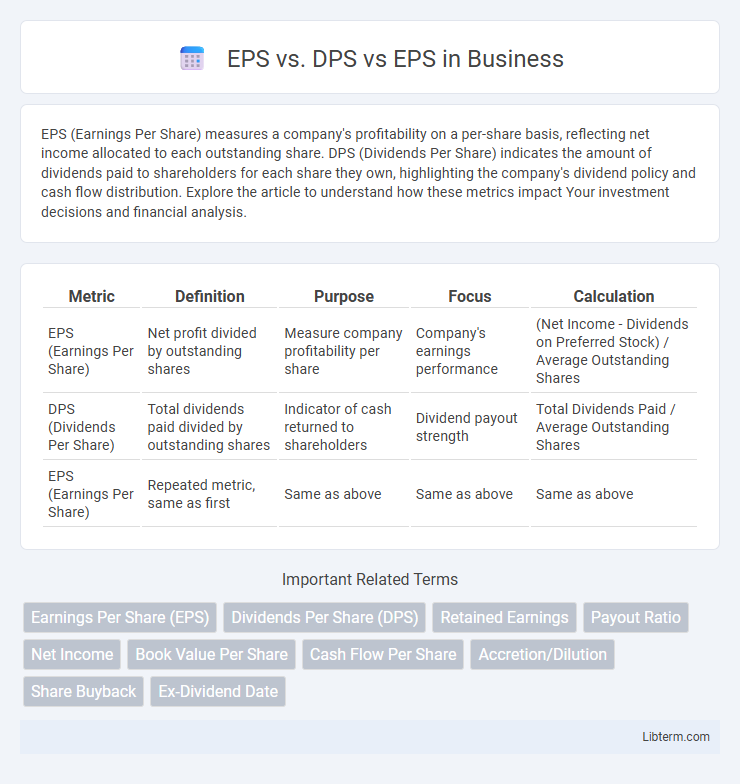
| Metric | Definition | Purpose | Focus | Calculation |
|---|---|---|---|---|
| EPS (Earnings Per Share) | Net profit divided by outstanding shares | Measure company profitability per share | Company's earnings performance | (Net Income - Dividends on Preferred Stock) / Average Outstanding Shares |
| DPS (Dividends Per Share) | Total dividends paid divided by outstanding shares | Indicator of cash returned to shareholders | Dividend payout strength | Total Dividends Paid / Average Outstanding Shares |
| EPS (Earnings Per Share) | Repeated metric, same as first | Same as above | Same as above | Same as above |
Understanding EPS: Definition and Importance
Earnings Per Share (EPS) measures a company's profitability by dividing net income by the number of outstanding shares, providing investors insight into financial performance. EPS is crucial for assessing a firm's profitability trends and comparing companies within the same industry. Unlike Dividends Per Share (DPS), which indicates cash returns to shareholders, EPS reflects overall earnings, guiding investment decisions and valuation metrics.
What is DPS? Key Concepts Explained
DPS, or Dividends Per Share, represents the amount of cash dividends a company pays to each outstanding share of common stock, serving as a critical metric for income-focused investors. It directly reflects the company's profitability distribution strategy and impacts shareholder returns alongside metrics like Earnings Per Share (EPS) and Price-to-Earnings (P/E) ratio. Understanding DPS helps investors assess dividend sustainability and compare income potential across companies in sectors with varying payout policies.
EPS vs. DPS: Core Differences
EPS (Earnings Per Share) measures a company's profitability by dividing net income by the number of outstanding shares, reflecting how much profit is attributed to each share. DPS (Dividends Per Share) indicates the actual cash returned to shareholders from earnings, representing the dividend amount paid for each share owned. The core difference lies in EPS showing potential earnings available to shareholders, while DPS reveals the portion of those earnings distributed as dividends, highlighting a company's dividend policy relative to its profitability.
How EPS Influences Investment Decisions
Earnings Per Share (EPS) directly impacts investment decisions by indicating a company's profitability on a per-share basis, helping investors assess growth potential and financial health. Dividends Per Share (DPS) reflects the actual cash returns distributed to shareholders, influencing income-focused investment strategies. Comparing EPS with DPS allows investors to evaluate whether earnings are reinvested for growth or paid out as dividends, shaping decisions on stock valuation and portfolio allocation.
The Role of DPS in Shareholder Value
DPS (Dividends Per Share) directly impacts shareholder value by providing tangible income, reflecting a company's commitment to returning profits to investors. While EPS (Earnings Per Share) indicates overall profitability, DPS demonstrates real cash flow benefits, influencing investor confidence and long-term stock price stability. Consistent or growing DPS often signals financial strength and management's positive outlook on sustained earnings, making it a critical metric for value-focused shareholders.
Calculating EPS: Step-by-Step Guide
Calculating Earnings Per Share (EPS) involves dividing net income minus preferred dividends by the weighted average number of outstanding common shares during the period. This metric reflects a company's profitability on a per-share basis and helps investors compare financial performance across companies. Understanding EPS is crucial as it differs from Dividends Per Share (DPS), which measures actual dividend payments, and from other metrics like Book Value Per Share, highlighting distinct aspects of financial health.
DPS Calculation and Practical Examples
DPS (Dividends Per Share) is calculated by dividing the total dividends paid by a company by the number of outstanding shares, providing a direct measure of the income earned by shareholders per share. EPS (Earnings Per Share) represents the net profit allocated to each share, indicating company profitability, while DPS reflects the actual cash return to investors. For example, if a company pays $1 million in dividends with 500,000 shares outstanding, the DPS is $2 per share, and if net earnings are $2 million, the EPS is $4 per share, highlighting both earnings capacity and shareholder reward.
EPS vs. DPS vs. EPS: Comparison Table
Earnings Per Share (EPS) measures a company's profitability by dividing net income by outstanding shares, reflecting overall financial performance, while Dividends Per Share (DPS) indicates the portion of earnings distributed as dividends to shareholders, highlighting cash return potential. A comparison table reveals EPS as a performance metric essential for assessing growth and profitability, whereas DPS focuses on shareholder income and dividend policy. Understanding the EPS vs. DPS relationship helps investors evaluate a company's balance between reinvestment and direct shareholder returns.
Pros and Cons of Focusing on EPS or DPS
Earnings Per Share (EPS) reflects a company's profitability by dividing net income by outstanding shares, providing insights into financial performance but may be influenced by accounting practices and share buybacks. Dividends Per Share (DPS) directly indicates shareholder returns through cash payouts, appealing to income-focused investors but potentially limiting reinvestment for growth. Focusing on EPS emphasizes growth potential and profitability, while DPS prioritizes consistent income, with companies often balancing both to attract different types of investors.
EPS and DPS in Financial Analysis: Best Practices
Earnings Per Share (EPS) measures a company's profitability by dividing net income by outstanding shares, providing key insight into financial health and performance trends. Dividends Per Share (DPS) reflects the portion of earnings distributed to shareholders, indicating the company's return on investment and dividend policy sustainability. Best practices in financial analysis involve comparing EPS trends to DPS payouts to evaluate growth potential, dividend stability, and overall shareholder value.
EPS vs. DPS Infographic