The demand curve illustrates the relationship between the price of a good and the quantity consumers are willing to purchase, typically sloping downward to indicate that lower prices increase demand. Understanding the demand curve helps businesses optimize pricing strategies and predict consumer behavior in various market conditions. Explore the rest of the article to learn how the demand curve impacts your market decisions and profitability.
Table of Comparison
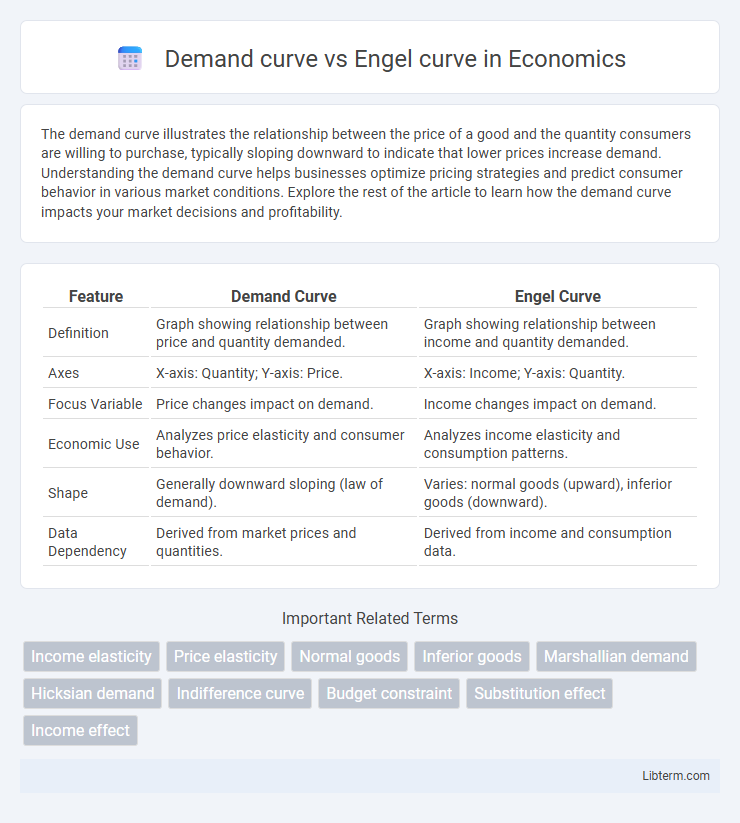
| Feature | Demand Curve | Engel Curve |
|---|---|---|
| Definition | Graph showing relationship between price and quantity demanded. | Graph showing relationship between income and quantity demanded. |
| Axes | X-axis: Quantity; Y-axis: Price. | X-axis: Income; Y-axis: Quantity. |
| Focus Variable | Price changes impact on demand. | Income changes impact on demand. |
| Economic Use | Analyzes price elasticity and consumer behavior. | Analyzes income elasticity and consumption patterns. |
| Shape | Generally downward sloping (law of demand). | Varies: normal goods (upward), inferior goods (downward). |
| Data Dependency | Derived from market prices and quantities. | Derived from income and consumption data. |
Introduction to Demand Curve and Engel Curve
The demand curve illustrates the relationship between the price of a good and the quantity demanded by consumers, typically sloping downward to indicate that lower prices increase demand. The Engel curve represents the relationship between a consumer's income and the quantity demanded of a good, showing how consumption patterns change as income varies. Both curves are essential tools in microeconomics for analyzing consumer behavior and market dynamics.
Key Differences Between Demand Curve and Engel Curve
The demand curve illustrates the relationship between the price of a good and the quantity demanded, showing how consumers adjust purchases in response to price changes. The Engel curve, on the other hand, depicts the relationship between a consumer's income level and the quantity demanded of a good, highlighting income effects on consumption patterns. While the demand curve emphasizes price elasticity, the Engel curve centers on income elasticity of demand.
Theoretical Foundations of Demand Curves
Demand curves represent the relationship between the price of a good and the quantity demanded, derived from the law of demand stating that quantity demanded decreases as price rises, holding other factors constant. Engel curves illustrate how household expenditure on a specific good varies with changes in income, reflecting income effects on consumption patterns. The theoretical foundation of demand curves stems from utility maximization and budget constraints, where consumers allocate income to maximize satisfaction, thereby generating downward-sloping demand functions.
Understanding Engel Curves: Definition and Significance
Engel curves illustrate the relationship between a consumer's income and the quantity of a good purchased, highlighting how changes in income affect consumption patterns. Unlike demand curves, which show the price-quantity relationship, Engel curves provide critical insights into consumer behavior and expenditure allocation across income levels. These curves are essential in economic analysis for understanding normal and inferior goods, revealing how demand shifts with income variations.
Determinants Influencing the Shape of Demand Curves
The shape of demand curves is primarily influenced by factors such as consumer income, price changes, and substitution effects, which reflect how quantity demanded varies with price fluctuations. Engel curves, contrastingly, emphasize the relationship between income levels and consumption patterns, illustrating how demand for goods evolves as consumer income changes. Key determinants shaping demand curves include consumer preferences, availability of substitutes, and the necessity versus luxury status of a product, which collectively affect elasticity and slope variations.
Income Changes and Their Impact on Engel Curves
Income changes directly influence Engel curves by illustrating how consumer demand for a good varies with income levels, typically showing an upward slope for normal goods and a downward slope for inferior goods. Unlike the demand curve, which relates price to quantity demanded, the Engel curve focuses solely on income variations, revealing shifts in consumption patterns as income rises or falls. This relationship highlights the sensitivity of demand to income changes, providing critical insights for market segmentation and income elasticity analysis.
Graphical Representation: Demand Curve vs Engel Curve
The demand curve graphically represents the relationship between the price of a good and the quantity demanded, typically downward sloping from left to right. In contrast, the Engel curve illustrates the relationship between a consumer's income and the quantity demanded of a good, usually upward sloping for normal goods. While the demand curve focuses on price elasticity, the Engel curve highlights income elasticity of demand through their distinct graphical plots.
Practical Applications in Economics
The demand curve illustrates the relationship between the price of a good and the quantity demanded, serving as a fundamental tool in price-setting and market analysis. The Engel curve highlights how consumer spending on a particular good varies with income changes, aiding in understanding consumption patterns and income elasticity. Together, these curves inform businesses and policymakers on pricing strategies, income effects, and resource allocation to optimize market outcomes.
Limitations of Demand and Engel Curves
Demand curves often fail to capture changes in consumer preferences and income effects at varying price levels, leading to inaccurate predictions in real-world markets. Engel curves face limitations by assuming consistent income allocation patterns without accounting for shifting consumption priorities or external factors influencing spending behavior. Both curves oversimplify complex consumer decision-making processes, ignoring non-price determinants and heterogeneity among households.
Conclusion: Choosing Between Demand and Engel Curves
The demand curve illustrates the relationship between the price of a good and the quantity demanded, reflecting consumer behavior under varying market prices. The Engel curve captures how consumer expenditure on a good changes with income, highlighting income elasticity and spending patterns. Choosing between demand and Engel curves depends on whether price sensitivity or income effects are the primary focus of the analysis for market strategy or economic research.
Demand curve Infographic