The supply curve illustrates the relationship between the price of a good and the quantity that producers are willing to supply. It typically slopes upward, indicating that higher prices incentivize increased production. Explore the full article to understand how shifts in the supply curve impact market equilibrium and your business decisions.
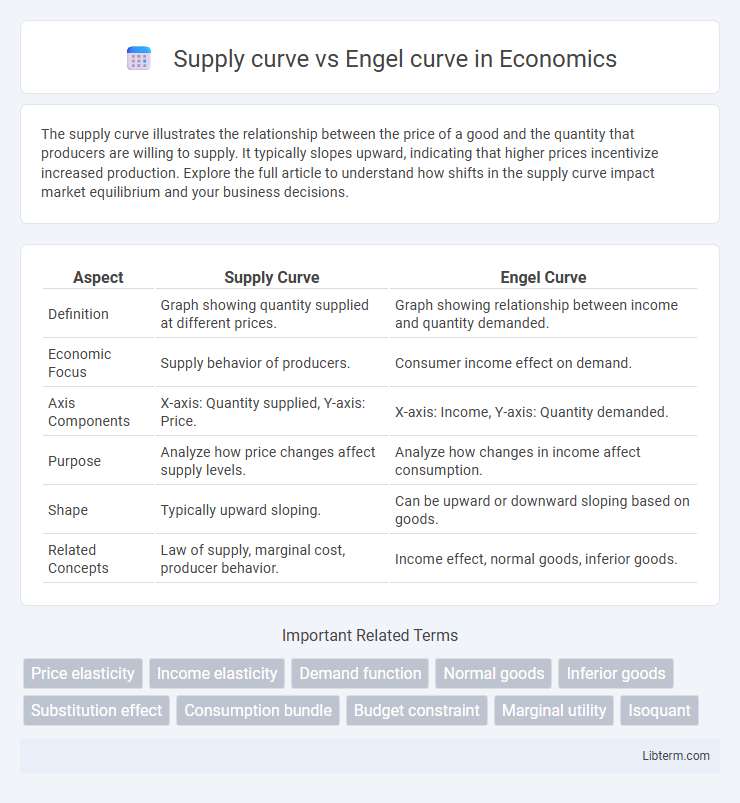
Table of Comparison
| Aspect | Supply Curve | Engel Curve |
|---|---|---|
| Definition | Graph showing quantity supplied at different prices. | Graph showing relationship between income and quantity demanded. |
| Economic Focus | Supply behavior of producers. | Consumer income effect on demand. |
| Axis Components | X-axis: Quantity supplied, Y-axis: Price. | X-axis: Income, Y-axis: Quantity demanded. |
| Purpose | Analyze how price changes affect supply levels. | Analyze how changes in income affect consumption. |
| Shape | Typically upward sloping. | Can be upward or downward sloping based on goods. |
| Related Concepts | Law of supply, marginal cost, producer behavior. | Income effect, normal goods, inferior goods. |
Introduction to Supply Curve and Engel Curve
The supply curve represents the relationship between the price of a good and the quantity supplied by producers, illustrating how higher prices typically lead to increased production. The Engel curve depicts the relationship between a consumer's income and the quantity of a good demanded, highlighting changes in consumption patterns as income varies. Understanding these curves is essential for analyzing producer behavior and consumer demand in microeconomic theory.
Definition and Basics of Supply Curve
The supply curve represents the relationship between the price of a good and the quantity supplied by producers, illustrating how supply increases as price rises. It is typically upward-sloping, reflecting the law of supply where higher prices incentivize producers to supply more. In contrast, the Engel curve shows the relationship between a consumer's income and the quantity demanded of a good, focusing on consumer behavior rather than production.
Definition and Basics of Engel Curve
The supply curve represents the relationship between the price of a good and the quantity producers are willing to sell, typically upward sloping to indicate higher supply at higher prices. The Engel curve, in contrast, depicts the relationship between a consumer's income and the quantity demanded of a particular good, illustrating changes in consumption patterns as income varies. Fundamental to consumer behavior analysis, the Engel curve helps identify whether a good is normal or inferior based on whether consumption increases or decreases with rising income.
Key Differences Between Supply Curve and Engel Curve
The supply curve illustrates the relationship between the price of a good and the quantity producers are willing to supply, reflecting producer behavior and market equilibrium. The Engel curve, in contrast, shows the relationship between a consumer's income and the quantity of a good purchased, highlighting consumer demand patterns based on income changes. While the supply curve is upward sloping due to the law of supply, the Engel curve's shape varies depending on whether the good is normal or inferior.
Factors Influencing the Supply Curve
The supply curve is primarily influenced by factors such as production costs, technology, input prices, and government policies, which determine the quantity of goods producers are willing to supply at various price levels. In contrast, the Engel curve illustrates the relationship between consumer income and quantity demanded of a good, focusing on consumer behavior rather than production factors. Understanding shifts in the supply curve requires analyzing changes in cost structures, resource availability, and market regulations that directly impact producers' supply decisions.
Factors Affecting the Engel Curve
Factors affecting the Engel curve primarily include household income, price changes of goods, and consumer preferences, which determine consumption patterns as income varies. Unlike the supply curve that reflects producer behavior and cost structures, the Engel curve specifically illustrates the relationship between income levels and quantity demanded of a particular good. Changes in demographic variables, such as family size and age distribution, also significantly influence the shape and position of the Engel curve.
Graphical Representation: Supply Curve vs Engel Curve
The supply curve graphically depicts the relationship between the quantity of goods supplied and the market price, typically sloping upward to indicate higher supply at increased prices. In contrast, the Engel curve illustrates the relationship between consumer income and the quantity demanded for a particular good, often showing how demand for normal and inferior goods changes as income varies. While the supply curve is plotted with price on the vertical axis and quantity supplied on the horizontal axis, the Engel curve features income on the vertical axis and quantity demanded on the horizontal axis, highlighting fundamentally different economic dynamics.
Role in Economic Analysis and Decision Making
The supply curve illustrates the relationship between the price of a good and the quantity producers are willing to supply, serving as a fundamental tool for analyzing market equilibrium and producer behavior. In contrast, the Engel curve depicts how consumer demand for a good changes with income variations, playing a critical role in understanding income elasticity and consumption patterns. Both curves inform economic decision-making by guiding policy formulation on production incentives and consumer welfare optimization.
Real-World Applications and Examples
The supply curve illustrates the relationship between the price of a good and the quantity producers are willing to supply, crucial in markets like agriculture where seasonal variations impact production levels and prices. The Engel curve depicts how consumer demand for a product changes with income, exemplified by increased spending on luxury goods as disposable income rises in emerging economies. Real-world applications include policymakers analyzing supply responses to price changes for resource allocation and businesses using Engel curves to tailor marketing strategies based on income demographics.
Conclusion: Comparing Supply Curve and Engel Curve
The supply curve illustrates the relationship between the quantity of goods producers are willing to supply and the market price, reflecting production decisions and cost structures. The Engel curve shows the relationship between a consumer's income and the quantity of a good demanded, highlighting consumption patterns based on income changes. Comparing both, the supply curve focuses on producer behavior under price variations, while the Engel curve centers on consumer behavior influenced by income fluctuations, providing complementary insights into market dynamics.
Supply curve Infographic