An isocost line represents all combinations of inputs that cost the same amount, helping businesses optimize production expenditures. It plays a crucial role in determining the most cost-effective input mix for producing a given level of output. Explore the rest of the article to understand how isocost lines interact with isoquants to maximize your firm's efficiency.
Table of Comparison
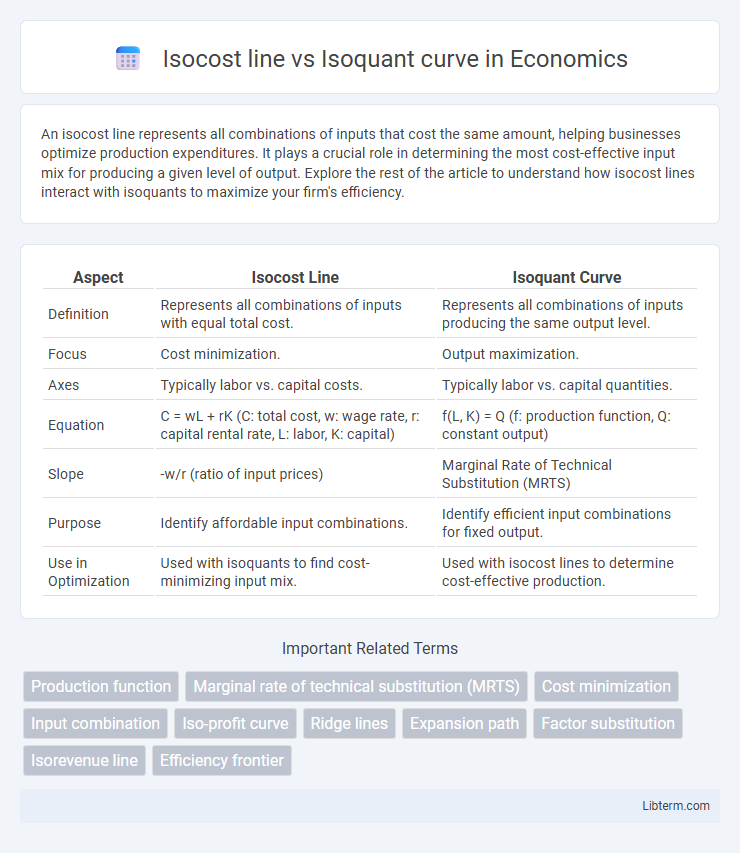
| Aspect | Isocost Line | Isoquant Curve |
|---|---|---|
| Definition | Represents all combinations of inputs with equal total cost. | Represents all combinations of inputs producing the same output level. |
| Focus | Cost minimization. | Output maximization. |
| Axes | Typically labor vs. capital costs. | Typically labor vs. capital quantities. |
| Equation | C = wL + rK (C: total cost, w: wage rate, r: capital rental rate, L: labor, K: capital) | f(L, K) = Q (f: production function, Q: constant output) |
| Slope | -w/r (ratio of input prices) | Marginal Rate of Technical Substitution (MRTS) |
| Purpose | Identify affordable input combinations. | Identify efficient input combinations for fixed output. |
| Use in Optimization | Used with isoquants to find cost-minimizing input mix. | Used with isocost lines to determine cost-effective production. |
Introduction to Isocost Line and Isoquant Curve
Isocost lines represent combinations of input factors, such as labor and capital, that incur the same total cost, reflecting budget constraints for production. Isoquant curves illustrate different combinations of inputs that yield the same level of output, demonstrating production efficiency. Together, they form the foundation for optimizing production decisions by balancing costs against output levels.
Definition of Isocost Line
An isocost line represents all combinations of inputs, such as labor and capital, that incur the same total cost, serving as a budget constraint for producers. It is defined by the equation C = wL + rK, where C is total cost, w is the wage rate, L is labor input, r is the rental rate of capital, and K is capital input. The slope of the isocost line equals the ratio of input prices (-w/r), indicating trade-offs between labor and capital while maintaining constant cost.
Definition of Isoquant Curve
An isoquant curve represents all possible combinations of two inputs, such as labor and capital, that produce the same level of output in production theory. It illustrates the substitution effect between inputs while maintaining constant output, allowing firms to analyze efficient resource allocation. Unlike the isocost line, which shows cost constraints, the isoquant curve focuses specifically on the technological relationship between inputs and output levels.
Key Differences Between Isocost Line and Isoquant Curve
The isocost line represents all combinations of inputs that cost the same total amount, reflecting budget constraints in production, while the isoquant curve shows all combinations of inputs that produce the same level of output, emphasizing production efficiency. The slope of the isocost line is determined by input prices, indicating cost trade-offs, whereas the slope of the isoquant curve, known as the marginal rate of technical substitution (MRTS), reflects the rate at which one input can be substituted for another without changing output. Isocost lines shift with changes in input prices and budget, while isoquant curves remain fixed for a given output level, highlighting the distinct roles these graphical tools play in production and cost analysis.
Mathematical Representation of Isocost Line
The isocost line is mathematically represented by the equation C = wL + rK, where C is the total cost, w is the wage rate of labor (L), and r is the rental rate of capital (K). This linear equation shows all combinations of labor and capital that result in the same total cost, forming a straight line with slope -w/r. In contrast, the isoquant curve represents different combinations of labor and capital yielding the same output level, typically expressed implicitly by a production function Q = f(L, K).
Mathematical Representation of Isoquant Curve
The mathematical representation of an isoquant curve is typically expressed as a production function \( Q = f(L, K) \), where \( Q \) denotes output, and \( L \) and \( K \) represent the quantities of labor and capital, respectively. Unlike an isocost line, which is represented by the linear equation \( C = wL + rK \) showing combinations of labor and capital that result in the same cost, the isoquant curve is usually non-linear and indicates combinations of input factors that yield the same level of output. The isoquant's shape reflects the marginal rate of technical substitution (MRTS), which is derived from the partial derivatives \( \frac{\partial Q}{\partial L} \) and \( \frac{\partial Q}{\partial K} \), mathematically illustrating how inputs can be substituted without changing production levels.
Graphical Analysis: Isocost vs Isoquant
The isocost line represents combinations of inputs, typically labor and capital, that result in the same total cost, illustrated as a straight line with a slope equal to the ratio of input prices. The isoquant curve plots different combinations of inputs that produce the same level of output, typically convex to the origin reflecting diminishing marginal rates of technical substitution. Graphically, the equilibrium point occurs where an isoquant is tangent to an isocost line, identifying the cost-minimizing input combination for a given output level.
Economic Interpretation and Significance
The isocost line represents combinations of input factors that incur the same total cost, reflecting budget constraints faced by firms in production. The isoquant curve illustrates all possible input combinations that yield a specific level of output, highlighting production efficiency and input substitutability. Analyzing the intersection of isocost lines and isoquant curves enables firms to determine optimal input combinations that minimize costs while maintaining desired output levels, a fundamental concept in production theory and cost minimization strategies.
Applications in Production Optimization
Isocost lines and isoquant curves are essential tools in production optimization, helping firms determine the most cost-effective combination of inputs to achieve a desired output level. The isocost line represents all input combinations that incur the same total cost, reflecting budget constraints, while the isoquant curve illustrates all input combinations yielding the same output quantity, indicating production technology. By analyzing the tangency points between isoquants and isocost lines, businesses can identify optimal input mixes that minimize expenses and maximize efficiency, thereby enhancing overall production performance.
Conclusion: Isocost Line vs Isoquant Curve
Isocost lines represent combinations of inputs that incur the same total cost, while isoquant curves depict input combinations that yield the same level of output. The intersection of an isoquant curve and an isocost line identifies the optimal input mix for cost minimization at a given production level. Understanding the differences between these two concepts is essential for efficient resource allocation and production optimization in economics.
Isocost line Infographic