The Laffer Curve illustrates the relationship between tax rates and tax revenue, demonstrating that increasing tax rates beyond a certain point can actually reduce government income. Understanding this economic principle helps you evaluate how tax policies impact economic growth and public finances. Explore the rest of the article to learn how the Laffer Curve influences taxation and fiscal strategy.
Table of Comparison
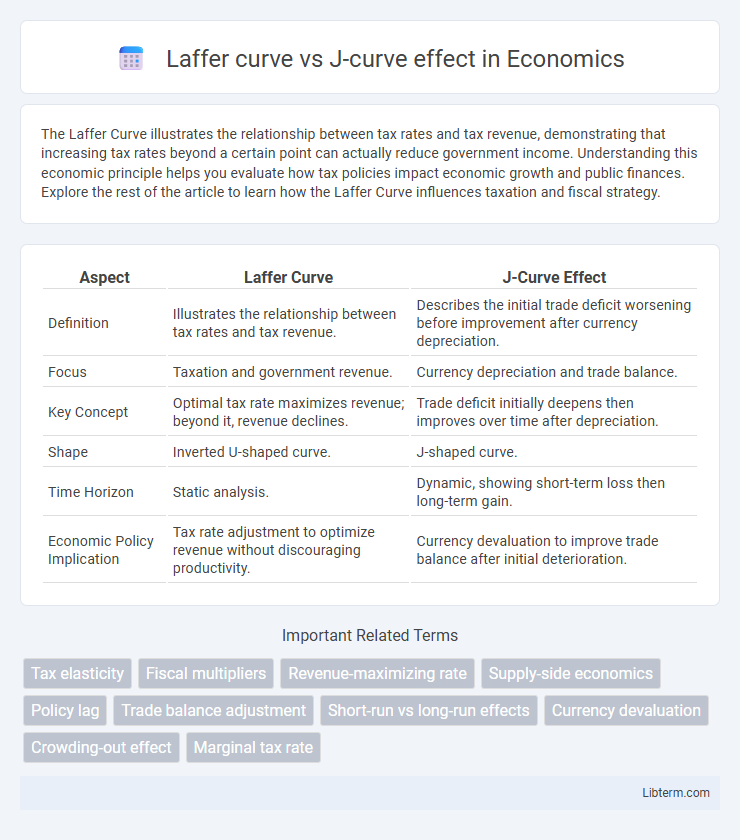
| Aspect | Laffer Curve | J-Curve Effect |
|---|---|---|
| Definition | Illustrates the relationship between tax rates and tax revenue. | Describes the initial trade deficit worsening before improvement after currency depreciation. |
| Focus | Taxation and government revenue. | Currency depreciation and trade balance. |
| Key Concept | Optimal tax rate maximizes revenue; beyond it, revenue declines. | Trade deficit initially deepens then improves over time after depreciation. |
| Shape | Inverted U-shaped curve. | J-shaped curve. |
| Time Horizon | Static analysis. | Dynamic, showing short-term loss then long-term gain. |
| Economic Policy Implication | Tax rate adjustment to optimize revenue without discouraging productivity. | Currency devaluation to improve trade balance after initial deterioration. |
Introduction to Economic Curves: Laffer Curve and J-Curve Effect
The Laffer Curve illustrates the relationship between tax rates and tax revenue, showing that increasing tax rates beyond an optimal point decreases total revenue. The J-Curve effect describes how a country's trade balance initially worsens after currency depreciation before improving over time. Both curves demonstrate non-linear economic relationships that help policymakers predict outcomes of fiscal and monetary changes.
Defining the Laffer Curve: Taxation and Revenue
The Laffer Curve illustrates the relationship between tax rates and tax revenue, showing that increasing tax rates beyond a certain point can lead to a decrease in total revenue due to diminished economic activity. It defines an optimal tax rate where government revenue is maximized without discouraging income generation or investment. This concept contrasts with the J-curve effect, which primarily describes short-term economic adjustments following policy changes or external shocks rather than tax revenue dynamics.
Understanding the J-Curve Effect: Trade Balance Dynamics
The J-Curve effect describes the short-term deterioration and subsequent improvement of a country's trade balance following a depreciation of its currency, reflecting the delayed response of import and export volumes to price changes. Initially, higher import costs worsen the trade deficit, but over time, increased export competitiveness and reduced import demand improve the trade balance, creating a characteristic "J"-shaped path. Understanding this dynamic aids policymakers in anticipating the temporal impact of exchange rate adjustments on international trade and economic equilibrium.
Fundamental Differences Between the Laffer Curve and J-Curve
The Laffer Curve illustrates the relationship between tax rates and tax revenue, demonstrating that beyond a certain tax rate, increasing taxes actually reduces revenue due to decreased economic activity. The J-Curve effect, in contrast, describes the short-term worsening followed by long-term improvement in a country's trade balance following currency depreciation. Fundamentally, the Laffer Curve focuses on fiscal policy impacts on government revenue, while the J-Curve centers on international trade and currency valuation effects on economic performance.
Graphical Representation: Visualizing the Laffer and J-Curve
The Laffer Curve graphically depicts the relationship between tax rates and tax revenue, illustrating a peak where optimal taxation maximizes revenue before declining due to disincentives to work or invest. The J-Curve visualizes the short-term economic deterioration followed by long-term improvement after currency devaluation, showing a characteristic initial dip below the baseline and a subsequent rise above it. Both graphs utilize curvature to represent complex economic dynamics but focus on distinct phenomena: taxation efficiency versus exchange rate effects on trade balances.
Theoretical Underpinnings of the Laffer Curve
The Laffer Curve illustrates the theoretical relationship between tax rates and tax revenue, suggesting that tax revenue increases with higher rates up to an optimal point, beyond which further increases reduce revenue due to diminished economic incentives. Rooted in supply-side economics, the curve posits that excessively high tax rates discourage work, investment, and productivity, leading to lower taxable income and overall revenue. This theory contrasts with the J-curve effect, which focuses on trade balance dynamics following currency depreciation, emphasizing different economic mechanisms.
Economic Mechanisms Behind the J-Curve Effect
The J-curve effect in economics illustrates how a country's trade balance initially worsens following a currency depreciation before improving over time, driven by delayed price adjustments and contract lags in international trade. This phenomenon occurs as import costs rise immediately, while export volumes take longer to respond to lower prices due to demand elasticity and production delays. Understanding these dynamic responses helps differentiate the J-curve from the Laffer curve, which maps tax rates to government revenue rather than trade balance fluctuations.
Policy Implications: Taxation vs. Exchange Rate Adjustments
The Laffer curve illustrates the policy implication that excessive taxation can reduce government revenue by discouraging economic activity, suggesting an optimal tax rate maximizes revenue without harming growth. In contrast, the J-curve effect highlights that currency depreciation may initially worsen a trade balance before improving it, advising policymakers to consider short-term costs against long-term benefits in exchange rate adjustments. Effective fiscal and monetary strategies require balancing these dynamics to enhance economic stability and growth.
Case Studies: Real-World Examples of the Laffer Curve and J-Curve
Case studies of the Laffer Curve include the Reagan tax cuts in the 1980s, which demonstrated how reducing marginal tax rates spurred economic growth and increased tax revenues in the United States, illustrating the curve's principle that lower tax rates can lead to higher revenue up to an optimal point. Real-world examples of the J-Curve effect are evident in currency devaluations such as the British pound after the 1992 ERM crisis, where initial trade deficits worsened before improving as exports became more competitive. These case studies highlight how both economic theories manifest differently: the Laffer Curve focuses on tax policy and revenue optimization, while the J-Curve captures short-term losses followed by gains in balance of payments or growth.
Conclusion: Comparing Impacts on Fiscal and Trade Policy
The Laffer curve illustrates the relationship between tax rates and tax revenue, showing that beyond a certain point, higher taxes reduce revenue, impacting fiscal policy effectiveness. The J-curve effect describes how trade balances initially worsen following currency depreciation before improving, emphasizing the time lag in trade policy outcomes. Comparing both, the Laffer curve highlights optimal tax rate adjustments for revenue maximization, while the J-curve underscores the delayed benefits of currency devaluation on trade balance improvement.
Laffer curve Infographic