The marginal propensity to consume (MPC) measures the proportion of additional income that a consumer spends on goods and services rather than saving. Understanding MPC is crucial for predicting the effects of fiscal policy and changes in consumer behavior on overall economic demand. Explore the rest of the article to see how your spending patterns influence economic growth and policy decisions.
Table of Comparison
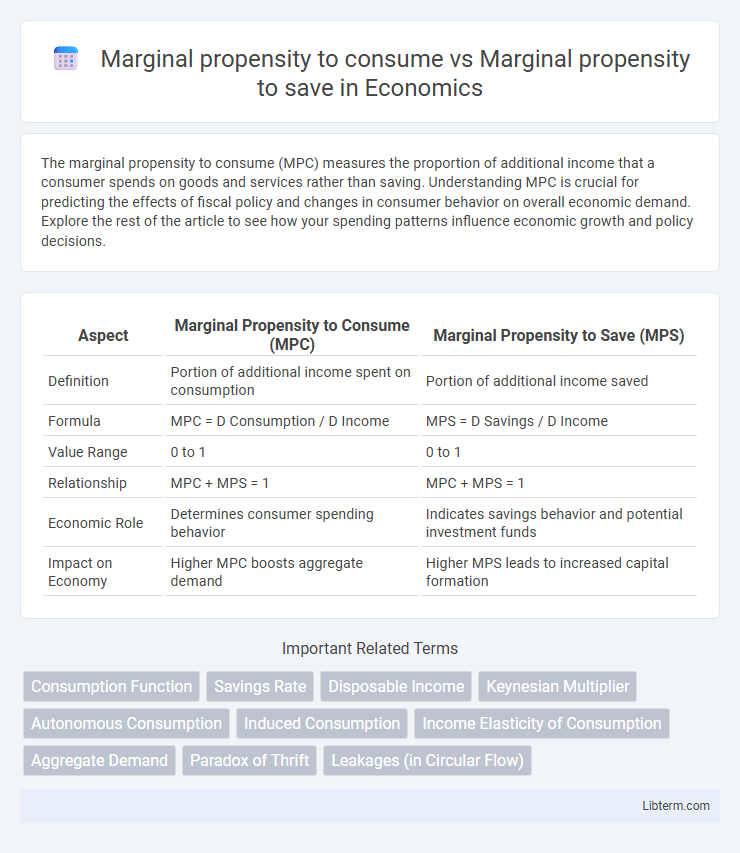
| Aspect | Marginal Propensity to Consume (MPC) | Marginal Propensity to Save (MPS) |
|---|---|---|
| Definition | Portion of additional income spent on consumption | Portion of additional income saved |
| Formula | MPC = D Consumption / D Income | MPS = D Savings / D Income |
| Value Range | 0 to 1 | 0 to 1 |
| Relationship | MPC + MPS = 1 | MPC + MPS = 1 |
| Economic Role | Determines consumer spending behavior | Indicates savings behavior and potential investment funds |
| Impact on Economy | Higher MPC boosts aggregate demand | Higher MPS leads to increased capital formation |
Introduction to Marginal Propensity to Consume (MPC) and Save (MPS)
Marginal Propensity to Consume (MPC) measures the fraction of additional income spent on consumption, while Marginal Propensity to Save (MPS) represents the portion of extra income saved rather than spent. Both MPC and MPS are fundamental concepts in Keynesian economics, reflecting consumer behavior and influencing aggregate demand. The sum of MPC and MPS always equals one, illustrating the distribution of income between consumption and saving.
Defining MPC and MPS: Key Economic Concepts
Marginal propensity to consume (MPC) measures the percentage of additional income that a household spends on consumption, while marginal propensity to save (MPS) represents the portion of extra income saved rather than spent. MPC and MPS are fundamental concepts in Keynesian economics, with their sum always equaling one, reflecting the total distribution of an incremental increase in income. Understanding the balance between MPC and MPS is crucial for analyzing consumer behavior, designing fiscal policies, and predicting the multiplier effect on economic growth.
The Mathematical Relationship Between MPC and MPS
The marginal propensity to consume (MPC) and the marginal propensity to save (MPS) are directly related through a fundamental mathematical relationship where their sum always equals one (MPC + MPS = 1). This equation reflects that any additional income is either spent (consumed) or saved, ensuring a complete allocation of incremental income. Understanding this relationship is crucial for analyzing consumer behavior and predicting the impact of fiscal policies on aggregate demand.
Behavioral Economics: Factors Influencing MPC and MPS
Behavioral economics reveals that the Marginal Propensity to Consume (MPC) and Marginal Propensity to Save (MPS) are influenced by cognitive biases, such as present bias and mental accounting, which affect how individuals allocate additional income toward consumption or saving. Factors like income levels, financial literacy, and emotional responses to economic uncertainty significantly shape these propensities, with lower-income groups typically exhibiting higher MPC due to pressing consumption needs. Understanding these behavioral drivers helps policymakers design interventions that target consumption smoothing and savings incentives more effectively, enhancing economic stability.
Real-World Examples of MPC and MPS in Action
The marginal propensity to consume (MPC) and marginal propensity to save (MPS) demonstrate distinct consumer behaviors in real-world economies, whereby an MPC of 0.8 indicates that households spend 80% of additional income, as seen during economic booms in the United States. In contrast, an MPS of 0.2 reflects a propensity to save 20% of additional income, commonly observed in countries like Germany with higher savings rates and more cautious spending habits. These differences influence fiscal policy effectiveness, where higher MPCs can stimulate economic growth more rapidly, while higher MPS suggest increased capital accumulation and financial stability.
MPC vs MPS in Different Income Groups
Marginal propensity to consume (MPC) tends to be higher in lower-income groups, as these households allocate a larger share of additional income toward immediate consumption, whereas marginal propensity to save (MPS) increases with higher income levels due to greater capacity to allocate funds toward savings and investments. Empirical studies show that low-income families often exhibit MPC above 0.9, indicating nearly all additional income is spent, while high-income groups may have MPS exceeding 0.3, reflecting increased saving behavior. Understanding the inverse relationship between MPC and MPS across income brackets is crucial for designing effective fiscal policies targeting consumption-driven economic growth or savings enhancement.
Impact of Fiscal Policy on MPC and MPS
The marginal propensity to consume (MPC) measures the fraction of additional income spent on consumption, while the marginal propensity to save (MPS) indicates the fraction saved. Fiscal policy influences MPC and MPS through taxation and government spending, where tax cuts typically increase MPC by boosting disposable income, whereas increased government spending can raise overall demand, affecting consumption patterns. Changes in MPC and MPS directly impact the multiplier effect, shaping the effectiveness of fiscal stimulus or contraction in stabilizing economic growth.
MPC, MPS, and the Multiplier Effect
The marginal propensity to consume (MPC) measures the proportion of additional income that households spend on consumption, while the marginal propensity to save (MPS) represents the fraction of extra income saved rather than spent. These two metrics are complementary, as MPC + MPS = 1, providing crucial insight into consumer behavior and its effect on economic growth. The multiplier effect, calculated as 1/(1-MPC) or 1/MPS, amplifies initial spending changes, demonstrating how variations in MPC and MPS influence total national income through repeated rounds of consumption and saving.
Global Comparisons: MPC and MPS Across Countries
Marginal Propensity to Consume (MPC) and Marginal Propensity to Save (MPS) vary significantly across countries due to differences in economic development, income levels, and cultural factors influencing consumer behavior. High-income countries typically exhibit lower MPCs and higher MPS rates, reflecting greater capacity to save, while developing nations show higher MPCs, signaling stronger immediate consumption tendencies. Cross-country data reveal that economies with robust social safety nets often have lower MPCs, as households feel less pressure to spend marginal income quickly, affecting aggregate demand and savings rates globally.
Implications for Economic Growth and Policy Decisions
The marginal propensity to consume (MPC) influences economic growth by driving aggregate demand, as higher consumption stimulates production and job creation, whereas the marginal propensity to save (MPS) impacts capital accumulation and long-term investment potential. Policymakers targeting economic expansion often encourage higher MPC through fiscal stimuli like tax cuts or direct transfers, aiming to boost immediate spending. Conversely, promoting savings via policies such as interest rate incentives supports financial stability and funds investment, balancing short-term demand with sustainable growth.
Marginal propensity to consume Infographic