The Price-to-Sales (P/S) ratio measures a company's stock price relative to its revenue, providing insight into valuation compared to sales performance. It helps investors assess whether a stock is overvalued or undervalued based on the company's ability to generate revenue. Discover how understanding the P/S ratio can improve your investment decisions by reading the full article.
Table of Comparison
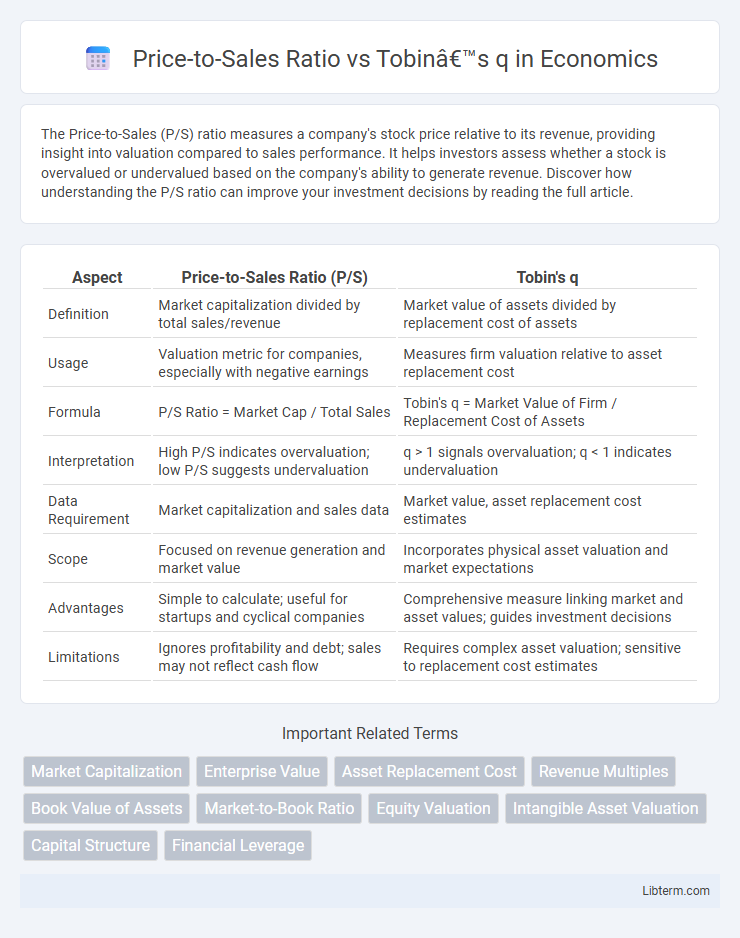
| Aspect | Price-to-Sales Ratio (P/S) | Tobin's q |
|---|---|---|
| Definition | Market capitalization divided by total sales/revenue | Market value of assets divided by replacement cost of assets |
| Usage | Valuation metric for companies, especially with negative earnings | Measures firm valuation relative to asset replacement cost |
| Formula | P/S Ratio = Market Cap / Total Sales | Tobin's q = Market Value of Firm / Replacement Cost of Assets |
| Interpretation | High P/S indicates overvaluation; low P/S suggests undervaluation | q > 1 signals overvaluation; q < 1 indicates undervaluation |
| Data Requirement | Market capitalization and sales data | Market value, asset replacement cost estimates |
| Scope | Focused on revenue generation and market value | Incorporates physical asset valuation and market expectations |
| Advantages | Simple to calculate; useful for startups and cyclical companies | Comprehensive measure linking market and asset values; guides investment decisions |
| Limitations | Ignores profitability and debt; sales may not reflect cash flow | Requires complex asset valuation; sensitive to replacement cost estimates |
Introduction to Price-to-Sales Ratio
The Price-to-Sales (P/S) ratio measures a company's market capitalization relative to its total sales, providing a valuation metric that is especially useful for firms with little or no earnings. Unlike Tobin's q, which compares market value to asset replacement cost, the P/S ratio focuses strictly on revenue generation, offering insights into how the market values every dollar of sales. Investors favor the P/S ratio for its simplicity and ability to assess growth potential in sectors where profits are inconsistent or negative.
Understanding Tobin’s q Ratio
Tobin's q ratio measures a company's market value relative to the replacement cost of its assets, providing insights into investment attractiveness and market valuation efficiency. Unlike the Price-to-Sales ratio, which compares market capitalization to revenue, Tobin's q captures broader economic value by incorporating asset replacement costs. A Tobin's q greater than one suggests that the market values the company above its asset base, indicating growth potential and favorable investment conditions.
Key Differences Between P/S Ratio and Tobin’s q
Price-to-Sales (P/S) ratio measures a company's market capitalization relative to its total sales, reflecting investor valuation per revenue dollar, while Tobin's q compares a firm's market value to the replacement cost of its assets, indicating growth potential and market inefficiency. The P/S ratio is a straightforward liquidity-based metric emphasizing sales performance, whereas Tobin's q incorporates asset valuation and capital replacement insights, providing a broader perspective on long-term value creation. Investors use P/S mainly for revenue efficiency analysis, whereas Tobin's q is preferred for assessing investment attractiveness in capital-intensive industries.
How Price-to-Sales Ratio is Calculated
The Price-to-Sales (P/S) Ratio is calculated by dividing a company's market capitalization by its total sales or revenue over a specific period, providing a valuation metric based on sales rather than earnings. In contrast, Tobin's q compares a company's market value to the replacement cost of its assets, emphasizing asset valuation rather than sales performance. The P/S Ratio is particularly useful for evaluating companies with inconsistent earnings, offering investors insight into market expectations relative to sales generation.
Calculating Tobin’s q: A Step-by-Step Guide
Tobin's q is calculated by dividing the market value of a company's assets by the replacement cost of those assets, providing a comprehensive measure of firm valuation that accounts for both market performance and asset value. To compute Tobin's q, first determine the market value of equity and debt, then estimate the replacement cost of physical assets, and finally, divide the total market value by the replacement cost. This method offers a more asset-focused alternative to the Price-to-Sales Ratio, aiding investors in assessing whether a company is over- or undervalued relative to its asset base.
Applications of Price-to-Sales Ratio in Valuation
The Price-to-Sales (P/S) ratio is a valuable metric in valuation, particularly for assessing companies with volatile earnings or negative profits, where traditional metrics like Price-to-Earnings (P/E) ratios may be misleading. Unlike Tobin's q, which compares market value to replacement cost of assets, the P/S ratio emphasizes revenue generation, providing investors with insights into how markets value each unit of sales. This ratio is extensively used in technology and start-up sectors, where sales growth potential drives investment decisions despite the absence of stable earnings.
When to Use Tobin’s q for Investment Analysis
Tobin's q is preferred over the Price-to-Sales (P/S) ratio when evaluating a firm's market valuation relative to its replacement cost, especially for capital-intensive industries where asset replacement is crucial. Unlike the P/S ratio, which primarily measures market price against revenue, Tobin's q incorporates asset values, making it more suitable for long-term investment decisions and assessing growth opportunities. Investors use Tobin's q to identify undervalued companies with tangible asset undervaluation, facilitating better capital allocation in sectors like manufacturing and utilities.
Advantages and Limitations of P/S Ratio
The Price-to-Sales (P/S) ratio offers a straightforward valuation metric by comparing a company's market capitalization to its revenue, making it particularly useful for evaluating early-stage or unprofitable firms where earnings are negative or volatile. Its advantages include simplicity, wide availability of sales data, and reduced susceptibility to accounting manipulation compared to earnings-based ratios. However, the P/S ratio's limitations arise from its failure to account for profitability, cost structure, or capital intensity, which can mislead investors when companies have significantly different margins or operating efficiencies, unlike Tobin's q that incorporates asset replacement costs and market value for a more comprehensive economic valuation.
Pros and Cons of Tobin’s q in Financial Analysis
Tobin's q, which compares a firm's market value to the replacement cost of its assets, provides a comprehensive measure of market valuation relative to asset base, capturing growth opportunities and market expectations. It incorporates both tangible and intangible assets, offering insights beyond the Price-to-Sales ratio, which only considers sales figures and may overlook asset quality and future profitability. However, Tobin's q can be challenging to calculate accurately due to difficulties in estimating replacement costs, asset depreciation, and intangible asset valuation, which can limit its practical use in financial analysis.
Price-to-Sales Ratio vs Tobin’s q: Which is Better?
Price-to-Sales Ratio (P/S) and Tobin's q both assess company valuation but differ in focus; P/S compares market capitalization to sales, highlighting revenue efficiency, while Tobin's q measures market value against replacement cost of assets to capture growth potential and asset valuation. P/S ratio is often favored for its simplicity and effectiveness in evaluating firms with volatile earnings, especially in growth sectors or early-stage companies where sales data is more reliable than earnings. Tobin's q offers broader insight into economic value but depends on accurate asset replacement cost estimates, making P/S ratio typically better for quick valuation and cross-sector comparison.
Price-to-Sales Ratio Infographic