Return on Assets (ROA) measures how efficiently a company uses its assets to generate profit, highlighting overall operational performance and asset management. This key financial metric helps investors and managers assess profitability relative to total assets, offering insight into business efficiency and potential growth. Explore the full article to understand how improving your ROA can enhance your company's financial health.
Table of Comparison
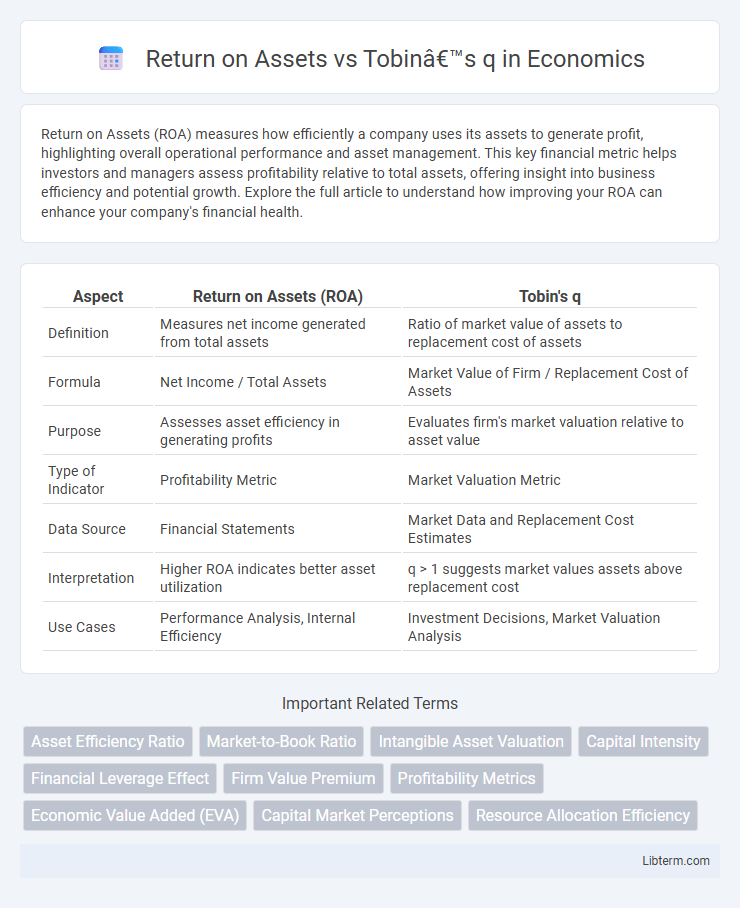
| Aspect | Return on Assets (ROA) | Tobin's q |
|---|---|---|
| Definition | Measures net income generated from total assets | Ratio of market value of assets to replacement cost of assets |
| Formula | Net Income / Total Assets | Market Value of Firm / Replacement Cost of Assets |
| Purpose | Assesses asset efficiency in generating profits | Evaluates firm's market valuation relative to asset value |
| Type of Indicator | Profitability Metric | Market Valuation Metric |
| Data Source | Financial Statements | Market Data and Replacement Cost Estimates |
| Interpretation | Higher ROA indicates better asset utilization | q > 1 suggests market values assets above replacement cost |
| Use Cases | Performance Analysis, Internal Efficiency | Investment Decisions, Market Valuation Analysis |
Introduction to Return on Assets (ROA) and Tobin’s q
Return on Assets (ROA) measures a company's profitability relative to its total assets, indicating how efficiently management utilizes assets to generate earnings. Tobin's q compares a firm's market value to the replacement cost of its assets, reflecting market expectations of future growth and asset productivity. Both metrics serve as critical indicators in financial analysis, with ROA emphasizing current operational efficiency and Tobin's q providing insights into market valuation and investment potential.
Defining Return on Assets (ROA)
Return on Assets (ROA) is a key financial metric that measures a company's profitability relative to its total assets, calculated by dividing net income by average total assets. ROA indicates how efficiently management uses assets to generate earnings, providing insight into operational performance. Unlike Tobin's q, which compares market value to asset replacement cost, ROA focuses directly on accounting profitability and asset utilization.
Understanding Tobin’s q Ratio
Tobin's q ratio measures a company's market value relative to the replacement cost of its assets, providing insight into growth opportunities and investment efficiency. Unlike Return on Assets (ROA), which evaluates current profitability by dividing net income by total assets, Tobin's q signals future expectations by comparing market capitalization and debt to asset replacement costs. A Tobin's q greater than 1 indicates that market valuation exceeds asset cost, suggesting potential for capital expansion and positive investor sentiment.
Key Differences Between ROA and Tobin’s q
Return on Assets (ROA) measures a company's net income generated from its total assets, providing insight into operational efficiency and profitability, whereas Tobin's q ratio compares a firm's market value to the replacement cost of its assets, reflecting market expectations and growth potential. ROA is calculated using accounting data and highlights internal performance, while Tobin's q relies on market capitalization and asset valuation, capturing external investor sentiment and investment attractiveness. The fundamental difference lies in ROA's focus on historical financial results versus Tobin's q emphasis on market-driven asset valuation and future growth prospects.
Calculation Methods: ROA vs Tobin’s q
Return on Assets (ROA) is calculated by dividing net income by total assets, revealing how efficiently a company utilizes its assets to generate profits. Tobin's q is obtained by dividing the market value of a firm's assets by the replacement cost of those assets, offering insights into market valuation relative to asset replacement cost. While ROA emphasizes operational efficiency and profitability, Tobin's q focuses on market expectations and asset valuation discrepancies.
Interpreting ROA in Financial Analysis
Return on Assets (ROA) measures a company's efficiency in generating profit from its total assets, reflecting operational performance and asset utilization. In financial analysis, ROA indicates how effectively management uses assets to produce earnings, with higher values signaling better efficiency and profitability. Compared to Tobin's q, which assesses market valuation relative to asset replacement cost, ROA focuses on internal financial health rather than market perceptions.
Interpreting Tobin’s q in Market Valuation
Tobin's q, calculated as the market value of a firm divided by the replacement cost of its assets, provides a forward-looking measure of market valuation, unlike Return on Assets (ROA), which reflects historical accounting performance. A Tobin's q greater than one suggests that the market values a company's assets more highly than their book value, indicating growth opportunities or intangible assets not captured in ROA. This market-based metric helps investors assess whether a firm's stock is overvalued or undervalued relative to its asset base, offering insights that ROA's backward-looking profitability ratio cannot provide.
Advantages and Limitations of ROA
Return on Assets (ROA) effectively measures a firm's profitability relative to its total assets, providing a clear indicator of how efficiently management uses assets to generate earnings. Its advantages include simplicity, easy calculation from financial statements, and direct focus on operational efficiency, making it a practical tool for comparing firms within the same industry. However, ROA has limitations such as ignoring market valuation and growth potential, failing to account for intangible assets, and being less informative for firms with heavy intangible investments compared to Tobin's q, which incorporates market value and replacement cost.
Advantages and Limitations of Tobin’s q
Tobin's q offers a forward-looking market-based metric by comparing a firm's market value to its asset replacement cost, capturing growth opportunities and intangible assets that Return on Assets (ROA) may overlook. It advantages investors by reflecting the firm's potential for value creation beyond current earnings but depends heavily on market efficiency and can be volatile due to stock price fluctuations. However, Tobin's q faces limitations such as sensitivity to market sentiment and difficulties in precisely estimating replacement costs, which can result in less stable and sometimes misleading valuations compared to the more straightforward and historically grounded ROA.
Practical Applications: When to Use ROA or Tobin’s q
Return on Assets (ROA) is most effective for evaluating a company's operational efficiency and profitability by measuring net income relative to total assets, making it ideal for internal performance assessment and short-term financial decision-making. Tobin's q, which compares market value to asset replacement cost, is better suited for strategic investment decisions, market valuation, and identifying growth opportunities or asset undervaluation in capital-intensive industries. Firms aiming to optimize asset utilization should rely on ROA, while those focusing on long-term market performance and investment potential benefit from analyzing Tobin's q.
Return on Assets Infographic