Isobaric lines, also known as isobars, are contour lines on a weather map that connect points of equal atmospheric pressure. These lines help meteorologists predict wind patterns and weather changes by illustrating pressure gradients across different regions. Explore the article to understand how isobaric lines influence weather forecasting and impact your daily life.
Table of Comparison
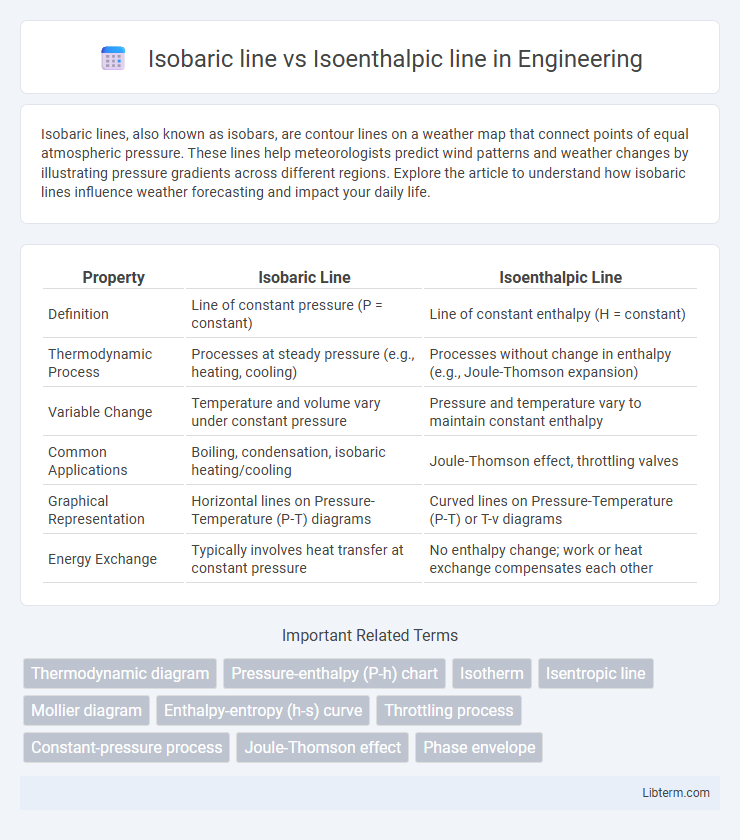
| Property | Isobaric Line | Isoenthalpic Line |
|---|---|---|
| Definition | Line of constant pressure (P = constant) | Line of constant enthalpy (H = constant) |
| Thermodynamic Process | Processes at steady pressure (e.g., heating, cooling) | Processes without change in enthalpy (e.g., Joule-Thomson expansion) |
| Variable Change | Temperature and volume vary under constant pressure | Pressure and temperature vary to maintain constant enthalpy |
| Common Applications | Boiling, condensation, isobaric heating/cooling | Joule-Thomson effect, throttling valves |
| Graphical Representation | Horizontal lines on Pressure-Temperature (P-T) diagrams | Curved lines on Pressure-Temperature (P-T) or T-v diagrams |
| Energy Exchange | Typically involves heat transfer at constant pressure | No enthalpy change; work or heat exchange compensates each other |
Introduction to Isobaric and Isoenthalpic Lines
Isobaric lines represent processes occurring at constant pressure, crucial for understanding phase changes and thermodynamic system behavior under steady pressure conditions. Isoenthalpic lines describe processes where enthalpy remains constant, often applied in throttling and expansion valve analyses in thermodynamics. Distinguishing between these lines aids in precise analysis of energy transformations and fluid flow in engineering applications.
Definition of Isobaric Line
An isobaric line represents a curve on a thermodynamic diagram where the pressure remains constant throughout the process. These lines are critical for analyzing processes in which pressure does not change, such as heating or cooling at constant pressure commonly found in piston-cylinder devices. In contrast, an isoenthalpic line depicts processes occurring at constant enthalpy, often used to study throttling or expansion events where enthalpy remains unchanged despite variations in pressure or temperature.
Definition of Isoenthalpic Line
The isoenthalpic line represents a thermodynamic path along which the enthalpy remains constant during a process, commonly observed in throttling or expansion valves. In contrast, an isobaric line depicts a state change at constant pressure, emphasizing pressure equilibrium rather than energy constancy. Understanding isoenthalpic lines is crucial in analyzing energy transformations where enthalpy, not pressure, defines the system's thermodynamic condition.
Thermodynamic Processes Represented
Isobaric lines represent thermodynamic processes occurring at constant pressure, commonly observed in phase changes such as boiling or melting, where temperature and enthalpy vary while pressure remains steady. Isoenthalpic lines depict processes with constant enthalpy, characteristic of throttling or Joule-Thomson expansion, involving changes in pressure and temperature without work or heat transfer. Understanding the differences between these lines is crucial for analyzing energy exchanges and property variations in fluid and gas systems.
Key Differences Between Isobaric and Isoenthalpic Lines
Isobaric lines represent processes occurring at constant pressure, while isoenthalpic lines denote processes at constant enthalpy. Isobaric lines are commonly used in phase change descriptions, such as boiling or melting, whereas isoenthalpic lines are critical in throttling and expansion processes in thermodynamics. The key difference lies in their constraints: isobaric processes maintain constant pressure allowing temperature and enthalpy to vary, while isoenthalpic processes keep enthalpy steady, often causing pressure and temperature changes.
Representation on Thermodynamic Diagrams
Isobaric lines represent constant pressure conditions on thermodynamic diagrams, typically appearing as horizontal lines on pressure-enthalpy charts, facilitating analysis of processes like heating or cooling at fixed pressure. Isoenthalpic lines denote constant enthalpy paths, often depicted as vertical or curved lines on enthalpy-entropy or pressure-enthalpy diagrams, crucial for studying throttling processes and expansion with no heat transfer. Distinguishing these lines enhances the understanding of energy transformations and fluid behavior under varying thermodynamic constraints.
Physical Significance in Real-World Applications
Isobaric lines represent processes occurring at constant pressure, crucial in engineering systems such as boilers and atmospheric studies where pressure remains steady. Isoenthalpic lines describe processes at constant enthalpy, essential in throttling valves and expansion devices where energy flow without heat exchange is analyzed. Both lines aid in understanding thermodynamic behavior in industrial applications, optimizing energy efficiency and system performance.
Common Examples and Use Cases
Isobaric lines represent constant pressure conditions and are commonly used in HVAC system analysis and engine thermodynamics to study heat exchange processes. Isoenthalpic lines indicate constant enthalpy and are essential in throttling valve operations and Joule-Thomson effect calculations where fluid expansion occurs without heat transfer. Both lines intersect in thermodynamic property charts such as pressure-enthalpy diagrams, facilitating efficient design and optimization in refrigeration cycles and gas processing industries.
Importance in Engineering and Science
Isobaric lines represent constant-pressure processes crucial for designing boilers, compressors, and turbines, enabling accurate prediction of fluid behavior under steady pressure conditions. Isoenthalpic lines denote constant-enthalpy processes important in throttling devices and Joule-Thomson cooling, allowing engineers to evaluate energy changes without heat transfer or work. Understanding these lines enhances thermodynamic analysis and optimization in energy systems, refrigeration cycles, and fluid dynamics applications.
Summary and Comparative Analysis
Isobaric lines represent processes at constant pressure, prominently used in thermodynamics to analyze phase changes and heat transfer in systems like boilers and condensers. Isoenthalpic lines denote processes at constant enthalpy, crucial for understanding throttling and expansion in devices such as valves and turbines where no heat exchange or work occurs. Comparing both, isobaric processes often involve heat addition or rejection affecting temperature, whereas isoenthalpic processes maintain energy content, emphasizing internal energy redistribution without pressure uniformity.
Isobaric line Infographic