The Nichols chart is a powerful tool used in control systems engineering to analyze and design feedback controllers by plotting open-loop frequency response data. It helps engineers assess system stability and performance by relating gain and phase margins directly on a single plot. Explore the rest of the article to understand how the Nichols chart can enhance your control system designs.
Table of Comparison
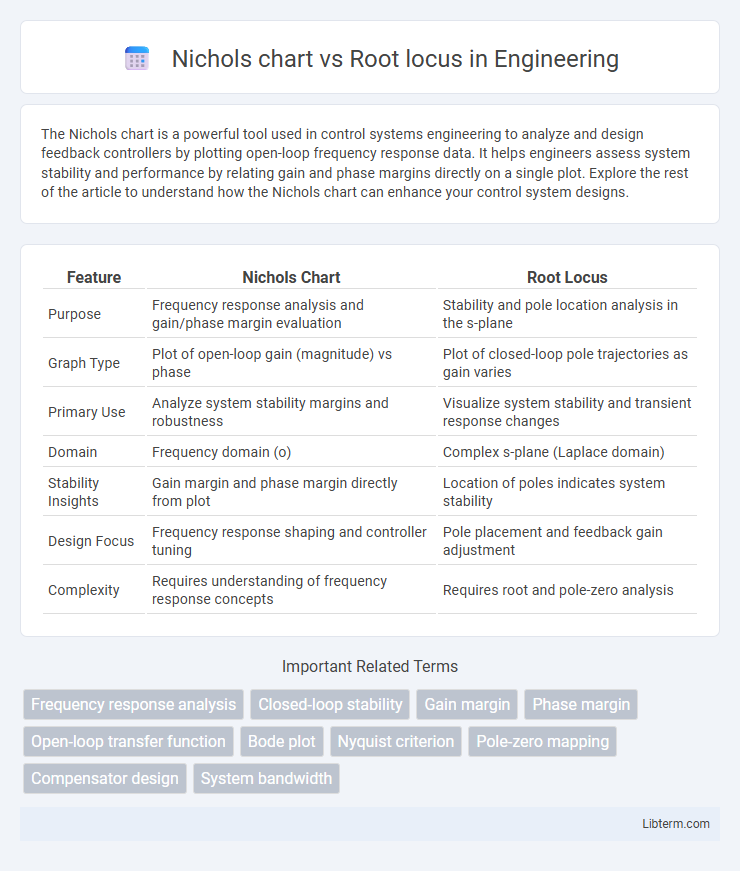
| Feature | Nichols Chart | Root Locus |
|---|---|---|
| Purpose | Frequency response analysis and gain/phase margin evaluation | Stability and pole location analysis in the s-plane |
| Graph Type | Plot of open-loop gain (magnitude) vs phase | Plot of closed-loop pole trajectories as gain varies |
| Primary Use | Analyze system stability margins and robustness | Visualize system stability and transient response changes |
| Domain | Frequency domain (o) | Complex s-plane (Laplace domain) |
| Stability Insights | Gain margin and phase margin directly from plot | Location of poles indicates system stability |
| Design Focus | Frequency response shaping and controller tuning | Pole placement and feedback gain adjustment |
| Complexity | Requires understanding of frequency response concepts | Requires root and pole-zero analysis |
Introduction to Nichols Chart and Root Locus
Nichols Chart and Root Locus are vital tools in control system analysis and design, each providing unique insights into system stability and frequency response. Nichols Chart plots open-loop gain versus phase on a single graph, enabling the direct assessment of gain and phase margins, crucial for understanding stability robustness. Root Locus traces the trajectories of system poles in the complex plane as a parameter varies, offering a clear visualization of how pole locations affect system stability and transient response.
Basic Concepts of Stability Analysis
Nichols chart and Root locus are fundamental tools in control engineering used for stability analysis and system design. The Nichols chart plots gain versus phase on a polar-like graph, directly relating frequency response to closed-loop stability margins and performance specifications. Root locus illustrates the movement of system poles in the complex plane as gain varies, providing insights into system stability and transient behavior based on pole locations relative to the imaginary axis.
Nichols Chart: Definition and Purpose
Nichols Chart is a powerful graphical tool used in control system engineering to analyze and design feedback controllers by plotting open-loop frequency response data in terms of gain (dB) versus phase (degrees). It allows engineers to assess system stability margins and performance characteristics directly, making it easier to visualize how changes in controller parameters affect stability and transient behavior. While Root Locus examines pole movements in the s-plane as gain varies, Nichols Chart emphasizes frequency domain characteristics, facilitating design adjustments based on gain and phase margin specifications.
Root Locus: Definition and Purpose
Root locus is a graphical method in control system engineering used to analyze the stability and transient response of a system as a specific parameter, typically the gain, varies. It plots the possible locations of the closed-loop poles in the complex plane, providing insight into how the system dynamics change with gain adjustments. Nichols chart, by contrast, focuses on frequency response analysis, displaying the relationship between gain and phase margin to assess system robustness and stability.
Visual Representation Differences
Nichols chart plots gain and phase simultaneously on a logarithmic scale, providing a two-dimensional frequency response visualization that highlights gain margin and phase margin directly. Root locus displays the trajectory of closed-loop poles in the complex plane as system gain varies, emphasizing system stability and transient response characteristics. Nichols chart offers insight into frequency domain performance, while root locus focuses on pole locations and stability margins.
Design Applications in Control Systems
Nichols chart offers precise frequency response design capabilities by combining gain and phase margins on a single plot, facilitating robust stability analysis and controller tuning. Root locus excels in time-domain design by illustrating pole-zero trajectories as system gain varies, enabling intuitive placement of closed-loop poles for desired transient response. Both tools complement control system design, with Nichols chart preferred for frequency domain specifications and Root locus favored for parametric stability and dynamic performance adjustments.
Advantages of Nichols Chart
Nichols chart offers distinct advantages in control system design by providing a direct relationship between open-loop gain and phase, facilitating stability margin assessment and robust controller tuning. Its ability to display frequency response characteristics in a single plot simplifies the visualization of gain and phase margins compared to Root locus methods. This clarity improves the precision of compensator design and enables efficient analysis of closed-loop system performance under varying conditions.
Advantages of Root Locus
Root locus provides a clear graphical representation of how the system poles move in the s-plane as a key parameter, typically gain, varies, enabling precise stability and transient response analysis. Unlike the Nichols chart, which plots frequency response data in the gain-phase plane, root locus directly correlates pole locations with closed-loop system behavior, making it intuitive for designing compensators and controllers. This advantage allows engineers to predict stability margins and system performance changes visually, facilitating iterative design adjustments with greater ease.
Practical Examples and Use Cases
Nichols chart is highly effective for frequency response analysis and stability margins in control system design, commonly used in tuning PID controllers for industrial processes like temperature control and servo motors. Root locus excels in visualizing how system pole locations shift with varying gain, making it ideal for analyzing transient response and stability in mechanical systems such as automotive suspension and robotics. Both tools complement each other by offering insights into gain adjustments and system behavior essential for robust control system implementation.
Choosing Between Nichols Chart and Root Locus
Choosing between Nichols chart and root locus depends on the control system analysis goal; Nichols chart excels in frequency response evaluation, providing gain and phase margin visualization that aids in robust stability assessment. Root locus offers insight into pole movement with varying gain, crucial for designing systems requiring precise pole placement and dynamic behavior control. Engineers prioritize Nichols chart for frequency domain design, while root locus remains favored for time domain and stability margin adjustments in feedback control systems.
Nichols chart Infographic