Mode is a statistical measure representing the most frequently occurring value in a data set, providing insight into the distribution of your data. Unlike mean and median, mode identifies the value that appears most often, making it especially useful for categorical data analysis. Explore the article to understand how mode can enhance your data interpretation and decision-making.
Table of Comparison
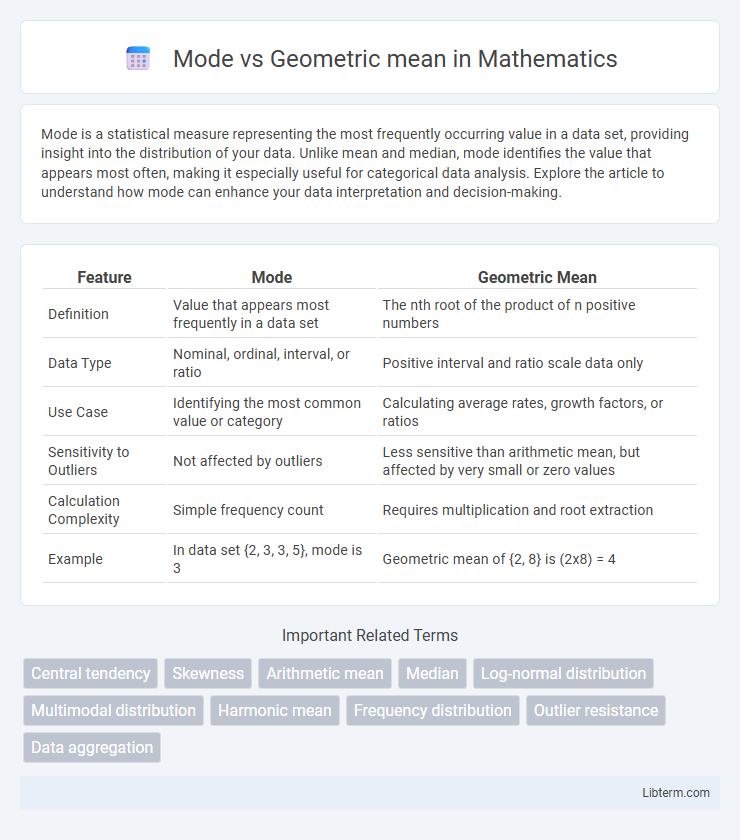
| Feature | Mode | Geometric Mean |
|---|---|---|
| Definition | Value that appears most frequently in a data set | The nth root of the product of n positive numbers |
| Data Type | Nominal, ordinal, interval, or ratio | Positive interval and ratio scale data only |
| Use Case | Identifying the most common value or category | Calculating average rates, growth factors, or ratios |
| Sensitivity to Outliers | Not affected by outliers | Less sensitive than arithmetic mean, but affected by very small or zero values |
| Calculation Complexity | Simple frequency count | Requires multiplication and root extraction |
| Example | In data set {2, 3, 3, 5}, mode is 3 | Geometric mean of {2, 8} is (2x8) = 4 |
Introduction to Mode and Geometric Mean
Mode represents the value that appears most frequently in a data set, making it useful for identifying the most common element within categorical or numerical data. Geometric mean, calculated by multiplying all values and then taking the nth root (where n is the total number of values), is especially effective for sets of positive numbers and rates, such as growth rates or financial returns. While mode highlights frequency, geometric mean provides a central tendency measure that minimizes the impact of extreme values in multiplicative data.
Defining the Mode: Key Concepts
The mode represents the most frequently occurring value in a data set, serving as a primary measure of central tendency especially in categorical data analysis. Unlike the geometric mean, which calculates the nth root of the product of values, the mode identifies peaks within frequency distributions without requiring numerical manipulation. This makes the mode crucial for understanding common trends and patterns in qualitative and discrete quantitative data.
Understanding the Geometric Mean
The geometric mean measures central tendency by multiplying all values in a dataset and then taking the nth root, where n is the number of values, making it particularly useful for data involving rates of change or growth. Unlike the mode, which identifies the most frequently occurring value, the geometric mean provides a more accurate average when dealing with skewed data or proportional growth rates, such as in finance or environmental studies. It minimizes the impact of extreme values and is ideal for calculating average ratios, percentages, or indices over time.
Mathematical Formulas and Calculation Methods
The mode is the value that appears most frequently in a data set, determined by identifying the highest frequency within the frequency distribution. The geometric mean is calculated using the formula \( \left( \prod_{i=1}^n x_i \right)^{\frac{1}{n}} \), where \( x_i \) represents each data point and \( n \) is the total number of observations. While the mode relies on categorical frequency counts, the geometric mean uses multiplicative aggregation and nth root extraction, making it suitable for datasets with positive values and proportional growth rates.
Advantages of Using Mode
The mode represents the most frequently occurring value in a data set, making it ideal for identifying common traits or preferences within categorical or nominal data. Unlike the geometric mean, the mode is not distorted by extreme values or outliers, providing a more accurate reflection of the most typical observation. It is especially useful in market research and quality control where understanding the most popular or frequent outcome is essential.
Benefits of the Geometric Mean
The geometric mean excels in accurately representing data sets with proportional growth rates or multiplicative factors, making it ideal for financial returns, population growth, and compound interest analysis. It minimizes the impact of extreme values or outliers, providing a more balanced central tendency in skewed distributions compared to the mode. This metric also supports meaningful aggregation of ratios or percentages, enabling precise comparisons and trend assessments across varying scales.
Mode vs Geometric Mean: Key Differences
Mode represents the most frequently occurring value in a data set, while the geometric mean calculates the central tendency by multiplying all values and taking the nth root, making it suitable for data with exponential growth or ratios. Unlike the mode, the geometric mean is sensitive to all values in the data set and provides a better measure for datasets with varying scales or percentages. The mode is useful for categorical data or identifying common occurrences, whereas the geometric mean is ideal for analyzing proportional growth rates and financial indices.
Applications in Real-World Scenarios
The mode is ideal for categorical data analysis, such as identifying the most popular product in market research or the most frequent customer complaint in service industries. The geometric mean excels in financial contexts, especially for assessing average growth rates of investments or population changes over time, where multiplicative effects dominate. Both measures provide critical insights tailored to data distribution characteristics, enhancing decision-making precision in diverse real-world applications.
Limitations and Potential Pitfalls
Mode can be misleading in datasets with multiple peaks or no distinct value, causing ambiguity in interpretation. Geometric mean is undefined for zero or negative numbers and may distort results when data include these values. Both measures can fail to represent central tendency accurately in highly skewed or multimodal distributions.
Choosing the Right Measure for Your Data
Choosing the right measure of central tendency depends on your data distribution and analysis goals; the mode identifies the most frequently occurring value, making it ideal for categorical or nominal data with distinct categories. The geometric mean, calculated by multiplying values and taking the nth root, is better suited for data involving rates of growth, ratios, or skewed distributions, such as financial returns or biological measures. Selecting between mode and geometric mean ensures accurate representation of typical values, enhancing the validity of statistical interpretations and decision-making.
Mode Infographic