Axis refers to a central line around which objects rotate or are symmetrically arranged, playing a crucial role in geometry, anatomy, and mechanical systems. Understanding the concept of an axis helps you analyze motion, balance, and structure in various scientific and engineering contexts. Explore the rest of the article to discover how axes influence different fields and practical applications.
Table of Comparison
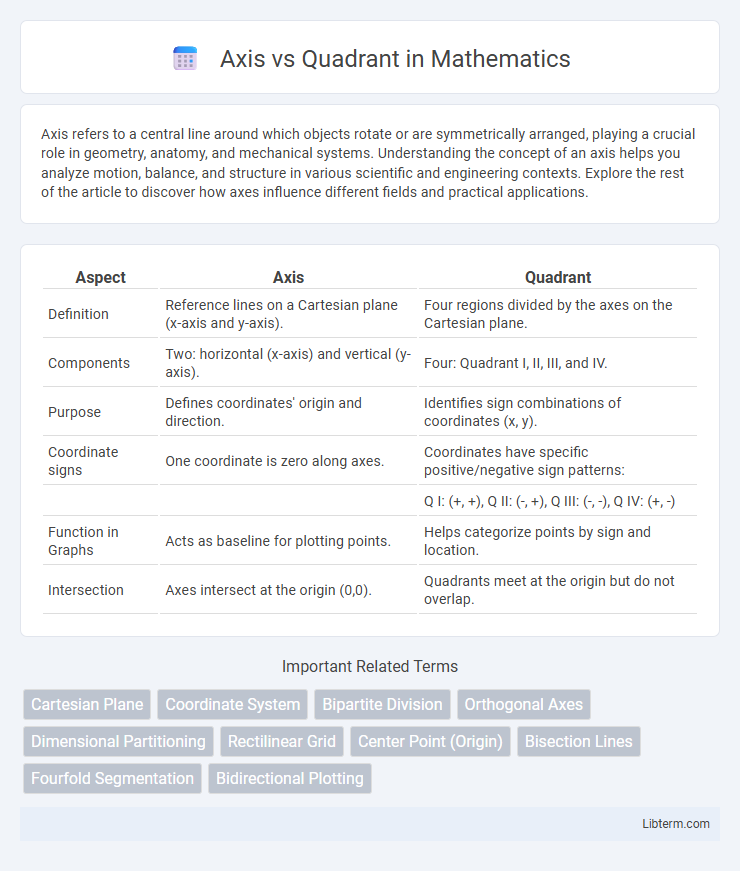
| Aspect | Axis | Quadrant |
|---|---|---|
| Definition | Reference lines on a Cartesian plane (x-axis and y-axis). | Four regions divided by the axes on the Cartesian plane. |
| Components | Two: horizontal (x-axis) and vertical (y-axis). | Four: Quadrant I, II, III, and IV. |
| Purpose | Defines coordinates' origin and direction. | Identifies sign combinations of coordinates (x, y). |
| Coordinate signs | One coordinate is zero along axes. | Coordinates have specific positive/negative sign patterns: |
| Q I: (+, +), Q II: (-, +), Q III: (-, -), Q IV: (+, -) | ||
| Function in Graphs | Acts as baseline for plotting points. | Helps categorize points by sign and location. |
| Intersection | Axes intersect at the origin (0,0). | Quadrants meet at the origin but do not overlap. |
Introduction to Axis and Quadrant
An axis is a straight reference line in a coordinate plane, typically representing the x-axis (horizontal) or y-axis (vertical), which helps to determine the position of points. A quadrant is one of the four regions created by the intersection of the x-axis and y-axis in a coordinate plane, each defined by the sign of the coordinates (positive or negative). Understanding axes and quadrants is fundamental in graphing functions and analyzing geometric data.
Defining Axis
An axis in mathematics and data visualization is a reference line used to measure and plot points within a coordinate system, typically defined as the horizontal x-axis and vertical y-axis. The axis serves as a boundary for dividing the plane into distinct sections, facilitating the identification of specific locations and orientations. In contrast, a quadrant is a region created by the intersection of these axes, representing one of the four areas on a Cartesian plane.
Defining Quadrant
A quadrant is a section of a coordinate plane divided by the intersection of two perpendicular axes, typically the x-axis and y-axis, creating four distinct regions. Each quadrant is defined by the sign of the x and y coordinates, with the first quadrant containing positive values for both x and y. Understanding the properties of each quadrant is essential for graphing functions, analyzing spatial relationships, and interpreting data trends in mathematics and applied sciences.
Key Differences Between Axis and Quadrant
The key differences between an axis and a quadrant lie in their geometric roles and definitions: an axis is a single straight reference line on a graph, typically the x-axis or y-axis, used to measure and plot data points. In contrast, a quadrant is one of the four distinct sections created when two perpendicular axes intersect at the origin, dividing the plane into four regions with unique coordinate sign combinations. Axes serve as measurement baselines, whereas quadrants categorize points based on their positional relationship relative to these axes.
Importance of Axes in Graphical Representation
Axes in graphical representation serve as fundamental reference lines that define the framework for plotting data points, allowing clear visualization of relationships between variables. The x-axis and y-axis provide a systematic way to measure and interpret values, while their intersection at the origin establishes a baseline for positive and negative directions. Properly scaled and labeled axes enhance data accuracy, support trend analysis, and facilitate effective communication of complex information in graphs and charts.
Role of Quadrants in Coordinate Systems
Quadrants divide the coordinate plane into four distinct regions, each characterized by the sign combinations of x and y coordinates, enabling precise localization of points. The axes serve as the boundaries between these quadrants, with the x-axis and y-axis intersecting at the origin (0,0) to establish the coordinate system's framework. This division assists in graphing functions, solving equations, and analyzing geometric relationships by segmenting plane data into manageable sections.
Applications of Axes in Mathematics and Science
Axes serve as fundamental reference lines in coordinate systems, enabling precise representation of data and geometric figures in mathematics and science. In Cartesian coordinates, the x-axis and y-axis define plane positions, facilitating graphing functions, analyzing vectors, and solving equations. Quadrants, resulting from the intersection of axes, categorize points based on the sign of their coordinates, instrumental in trigonometry, complex numbers, and spatial analysis.
Applications of Quadrants in Real-World Scenarios
Quadrants serve as crucial tools in real-world scenarios such as business strategy, where the SWOT analysis matrix divides opportunities and threats into four distinct sections to guide decision-making. In project management, the Eisenhower Matrix prioritizes tasks by urgency and importance, enhancing productivity and time management. Geographic information systems (GIS) use quadrants to segment spatial data for detailed analysis and efficient resource allocation.
Common Mistakes: Axis vs Quadrant
Confusing an axis with a quadrant often leads to errors in graph interpretation, as an axis is a reference line that divides the coordinate plane, while a quadrant is one of the four sections created by the intersection of the x-axis and y-axis. Mislabeling points or data within the wrong quadrant due to misunderstanding these definitions can distort analytical results. Accurate identification of axes and quadrants is crucial for precise data visualization and mathematical problem-solving.
Conclusion: Choosing Between Axis and Quadrant
Choosing between axis and quadrant depends on the nature of data visualization and analytical goals. Axes are ideal for representing continuous data along two dimensions, allowing precise measurement and comparison of values. Quadrants are more effective for identifying clusters and categorizing data points into distinct groups based on their position relative to intersecting axes.
Axis Infographic