Profiling involves analyzing data patterns to identify characteristics or behaviors within a specific group, enhancing decision-making processes across various industries like marketing, security, and healthcare. By leveraging advanced algorithms and machine learning, profiling can predict trends and personalize experiences tailored to Your needs. Explore the rest of this article to discover the techniques and benefits of effective profiling.
Table of Comparison
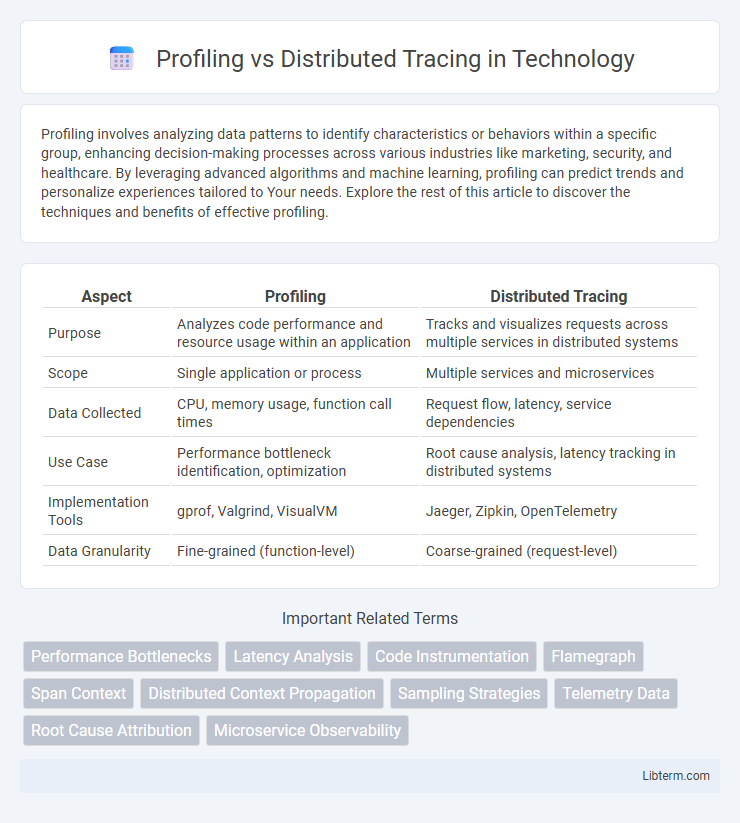
| Aspect | Profiling | Distributed Tracing |
|---|---|---|
| Purpose | Analyzes code performance and resource usage within an application | Tracks and visualizes requests across multiple services in distributed systems |
| Scope | Single application or process | Multiple services and microservices |
| Data Collected | CPU, memory usage, function call times | Request flow, latency, service dependencies |
| Use Case | Performance bottleneck identification, optimization | Root cause analysis, latency tracking in distributed systems |
| Implementation Tools | gprof, Valgrind, VisualVM | Jaeger, Zipkin, OpenTelemetry |
| Data Granularity | Fine-grained (function-level) | Coarse-grained (request-level) |
Introduction to Profiling and Distributed Tracing
Profiling collects detailed performance metrics of an application, such as CPU usage, memory allocation, and function execution times, enabling developers to identify bottlenecks at the code level. Distributed tracing tracks requests across multiple microservices or components, providing end-to-end visibility into the latency and execution path of transactions in complex, distributed systems. Both techniques are essential for optimizing performance but target different scopes: profiling focuses on internal code efficiency, while distributed tracing emphasizes system-level interaction and latency analysis.
Defining Profiling: Key Concepts
Profiling involves collecting detailed data on program execution to identify performance bottlenecks, memory usage, and CPU consumption. Key concepts of profiling include sampling, instrumentation, and call stack analysis, which help developers optimize code efficiency and resource allocation. Unlike distributed tracing, profiling provides granular insights at the code-function level within a single process or application instance.
Understanding Distributed Tracing: Core Principles
Distributed tracing captures the journey of a request as it travels through various microservices, providing detailed visibility into system performance and bottlenecks. It relies on unique trace identifiers and spans, which record timing and metadata for each service interaction, enabling precise root cause analysis. This method ensures comprehensive monitoring across complex, distributed architectures, improving debugging and operational efficiency.
Differences Between Profiling and Distributed Tracing
Profiling captures detailed performance metrics within a single application or service, identifying CPU usage, memory allocation, and bottlenecks at the code level. Distributed tracing tracks requests across multiple services and microservices, providing end-to-end visibility into transaction flow and latency in a distributed system. While profiling focuses on internal performance diagnostics, distributed tracing emphasizes inter-service communication and overall system behavior.
Advantages of Application Profiling
Application profiling offers in-depth insights into code execution, enabling precise identification of performance bottlenecks and inefficient resource usage. It provides granular data on CPU, memory, and I/O consumption, facilitating targeted optimizations that enhance overall application efficiency. Profiling supports continuous performance monitoring during development, leading to faster debugging and improved software quality.
Benefits of Distributed Tracing in Microservices
Distributed tracing provides end-to-end visibility across microservices, allowing developers to pinpoint performance bottlenecks and latency issues with precision. It captures detailed, time-stamped logs and contextual data from each service interaction, facilitating faster root cause analysis and reducing mean time to resolution (MTTR). This granular insight helps optimize resource allocation and improve user experience by ensuring seamless service communication in complex microservices architectures.
Use Cases: When to Use Profiling vs Distributed Tracing
Profiling is essential for identifying performance bottlenecks and optimizing resource usage within individual services or applications, making it ideal for in-depth CPU, memory, and I/O analysis during development and testing. Distributed tracing excels in monitoring and debugging complex microservices architectures by tracking request flows across multiple services, enabling rapid detection of latency issues and service dependencies in production. Use profiling when the goal is to fine-tune code efficiency, and rely on distributed tracing to gain end-to-end visibility and diagnose issues in distributed systems.
Challenges in Implementing Profiling and Tracing
Implementing profiling and distributed tracing presents unique challenges related to performance overhead, data volume, and complexity in analysis. Profiling often incurs higher CPU and memory usage, potentially impacting application responsiveness, while distributed tracing requires consistent propagation of trace context across microservices, which can be difficult to maintain in dynamic environments. Both techniques demand robust tooling and infrastructure to handle large-scale data collection and correlation for effective performance monitoring and root cause analysis.
Tools and Technologies for Profiling and Distributed Tracing
Profiling tools such as VisualVM, YourKit, and Py-Spy analyze application performance by capturing CPU usage, memory allocation, and thread activity within a single service. Distributed tracing technologies like Jaeger, Zipkin, and OpenTelemetry collect and visualize trace data across multiple microservices, enabling end-to-end latency analysis and root cause identification in complex distributed systems. Integration of profiling with distributed tracing tools enhances performance optimization by correlating low-level resource metrics with high-level request flows.
Choosing the Right Approach for Performance Monitoring
Profiling collects detailed performance data at the code level, ideal for diagnosing CPU and memory bottlenecks within specific functions or modules. Distributed tracing maps requests across microservices, enabling visibility into latency, error rates, and dependencies in complex, distributed architectures. Selecting the right approach depends on your system's architecture and monitoring goals: use profiling for in-depth analysis of individual components and distributed tracing for end-to-end performance insights in multi-service environments.
Profiling Infographic