The Sharpe Ratio measures the risk-adjusted return of an investment, helping investors understand how much excess return they receive for the extra volatility endured. A higher Sharpe Ratio indicates a more attractive risk-reward balance, crucial for making informed financial decisions. Explore the rest of the article to deepen your understanding of how the Sharpe Ratio can enhance your investment strategy.
Table of Comparison
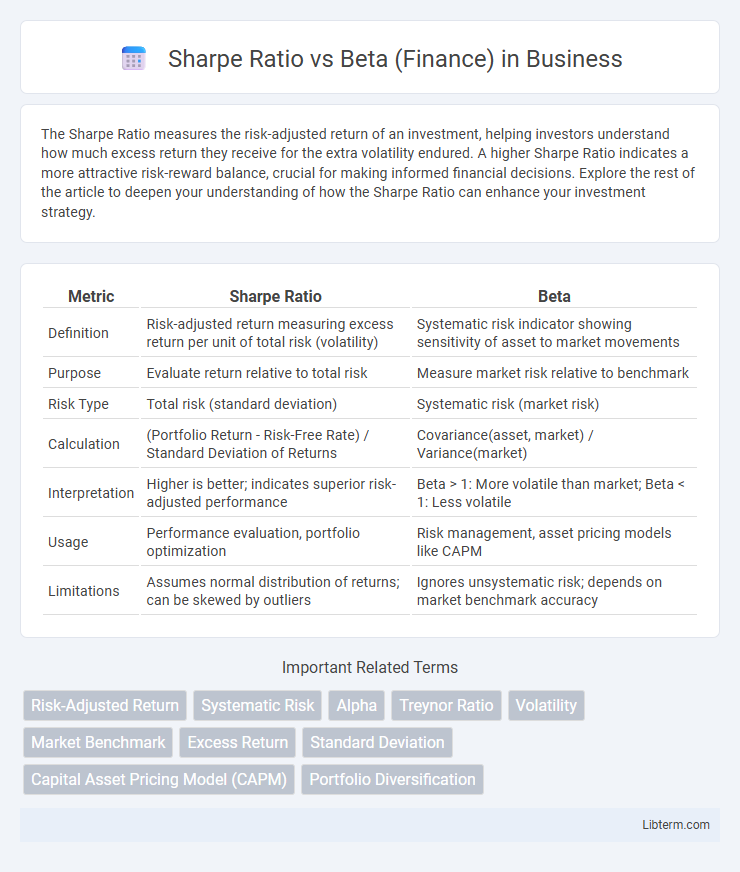
| Metric | Sharpe Ratio | Beta |
|---|---|---|
| Definition | Risk-adjusted return measuring excess return per unit of total risk (volatility) | Systematic risk indicator showing sensitivity of asset to market movements |
| Purpose | Evaluate return relative to total risk | Measure market risk relative to benchmark |
| Risk Type | Total risk (standard deviation) | Systematic risk (market risk) |
| Calculation | (Portfolio Return - Risk-Free Rate) / Standard Deviation of Returns | Covariance(asset, market) / Variance(market) |
| Interpretation | Higher is better; indicates superior risk-adjusted performance | Beta > 1: More volatile than market; Beta < 1: Less volatile |
| Usage | Performance evaluation, portfolio optimization | Risk management, asset pricing models like CAPM |
| Limitations | Assumes normal distribution of returns; can be skewed by outliers | Ignores unsystematic risk; depends on market benchmark accuracy |
Introduction to Sharpe Ratio and Beta
The Sharpe Ratio measures risk-adjusted return by comparing portfolio excess returns to its standard deviation, providing insight into performance efficiency. Beta quantifies a security's sensitivity to market movements, indicating systematic risk relative to a benchmark index. Both metrics are essential in portfolio management for evaluating risk and optimizing asset allocation.
Definition of Sharpe Ratio
The Sharpe Ratio measures risk-adjusted return by calculating the excess return of an investment over the risk-free rate divided by its standard deviation, highlighting how much return is earned per unit of total risk. Beta quantifies systematic risk by assessing an asset's volatility relative to the overall market, indicating sensitivity to market movements but not accounting for total risk or return. Investors use the Sharpe Ratio to evaluate portfolio performance on a risk-adjusted basis, while Beta focuses on market-related risk exposure.
Definition of Beta in Finance
Beta in finance measures a stock's volatility relative to the overall market, indicating its sensitivity to market movements. It quantifies systematic risk by showing how much a security's returns change in response to market fluctuations. Unlike the Sharpe Ratio, which evaluates risk-adjusted returns, Beta focuses specifically on market risk exposure and the expected return variability tied to market changes.
Key Differences Between Sharpe Ratio and Beta
The Sharpe Ratio measures risk-adjusted return by comparing portfolio excess returns to its total volatility, highlighting overall reward per unit of risk. In contrast, Beta quantifies systematic risk by assessing a security's sensitivity to market movements, indicating its relative volatility compared to a benchmark. While the Sharpe Ratio emphasizes total risk and return efficiency, Beta focuses solely on market-related risk exposure and correlation.
How to Calculate Sharpe Ratio
The Sharpe Ratio is calculated by subtracting the risk-free rate from the portfolio's return and then dividing the result by the standard deviation of the portfolio's excess return, effectively measuring risk-adjusted performance. Beta quantifies a stock's volatility relative to the overall market but does not account for total risk like the Sharpe Ratio does. Investors use the Sharpe Ratio to assess whether higher returns justify the risk, making it essential for portfolio optimization and comparison.
How to Calculate Beta
Beta is calculated by performing a regression analysis of an asset's returns against the returns of a benchmark index, typically using historical price data. The formula for beta is the covariance of the asset's returns and the market returns divided by the variance of the market returns. This metric quantifies the asset's sensitivity to market movements, where a beta greater than 1 indicates higher volatility relative to the market.
Interpreting Sharpe Ratio and Beta Values
Sharpe Ratio measures risk-adjusted return by comparing portfolio excess return to its total risk, with higher values indicating better risk-adjusted performance. Beta quantifies systematic risk relative to the market, where a beta greater than 1 implies higher volatility than the market and less than 1 indicates lower volatility. Interpreting both metrics together helps investors assess if returns justify the risk, balancing Sharpe Ratio's reward-to-risk efficiency with Beta's market sensitivity.
Use Cases: When to Use Sharpe Ratio vs Beta
The Sharpe Ratio is ideal for evaluating the risk-adjusted returns of a portfolio or investment by measuring excess returns per unit of total risk, making it suitable for comparing different asset classes or diversified portfolios. Beta measures systematic risk relative to the overall market, helping investors understand sensitivity to market movements and is best used for assessing individual stocks or sector exposure within a market context. Use the Sharpe Ratio when optimizing portfolios for risk-adjusted performance and Beta for gauging market-related volatility and correlation with benchmark indices.
Advantages and Limitations of Each Metric
The Sharpe Ratio measures risk-adjusted returns by evaluating the excess return per unit of total risk, making it ideal for comparing investment performance across diversified portfolios. Beta quantifies systematic risk by assessing an asset's sensitivity to market movements, aiding in understanding market-related volatility but ignoring idiosyncratic risk. While the Sharpe Ratio is limited by its reliance on historical volatility and assumes normally distributed returns, Beta's limitation lies in its focus solely on market risk, potentially overlooking other risk factors affecting asset performance.
Choosing the Right Metric for Investment Decisions
Choosing between Sharpe Ratio and Beta depends on investment goals and risk assessment needs. The Sharpe Ratio measures risk-adjusted return by comparing portfolio returns to volatility, ideal for evaluating overall performance in relation to total risk. Beta quantifies systematic risk relative to market movements, making it crucial for investors focusing on market sensitivity and portfolio diversification strategies.
Sharpe Ratio Infographic