Gross profit represents the difference between your business's revenue and the cost of goods sold, reflecting core profitability before operating expenses. This key financial metric helps you evaluate your production efficiency and pricing strategy effectively. Explore the rest of the article to understand how to improve your gross profit and drive business growth.
Table of Comparison
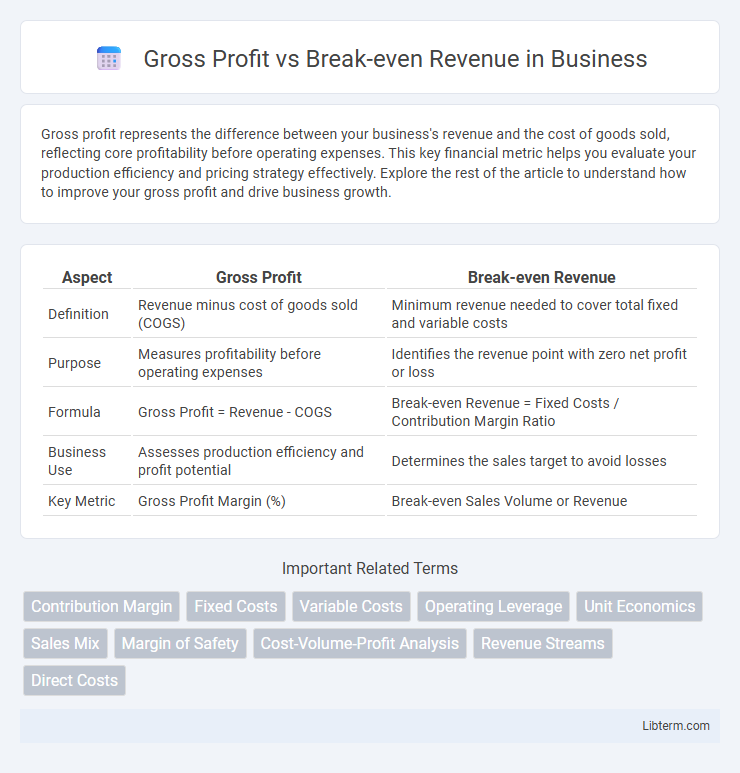
| Aspect | Gross Profit | Break-even Revenue |
|---|---|---|
| Definition | Revenue minus cost of goods sold (COGS) | Minimum revenue needed to cover total fixed and variable costs |
| Purpose | Measures profitability before operating expenses | Identifies the revenue point with zero net profit or loss |
| Formula | Gross Profit = Revenue - COGS | Break-even Revenue = Fixed Costs / Contribution Margin Ratio |
| Business Use | Assesses production efficiency and profit potential | Determines the sales target to avoid losses |
| Key Metric | Gross Profit Margin (%) | Break-even Sales Volume or Revenue |
Understanding Gross Profit: Definition and Importance
Gross profit represents the revenue remaining after subtracting the cost of goods sold (COGS), serving as a critical indicator of a company's core profitability. Understanding gross profit is essential for assessing how efficiently a business produces and sells its products before accounting for operating expenses. This metric directly impacts break-even revenue calculations, as higher gross profit margins reduce the revenue needed to cover fixed costs and achieve financial sustainability.
What Is Break-even Revenue? Key Concepts Explained
Break-even revenue is the minimum amount of sales income a company must generate to cover all fixed and variable costs, resulting in zero profit or loss. It is calculated by dividing total fixed costs by the contribution margin ratio, which is the difference between sales price per unit and variable cost per unit relative to sales price. Understanding break-even revenue helps businesses set sales targets, pricing strategies, and assess financial viability before achieving profitability.
Gross Profit vs. Break-even Revenue: Core Differences
Gross profit measures the actual earnings remaining after deducting the cost of goods sold, reflecting profitability on sales, while break-even revenue represents the minimum sales amount needed to cover all fixed and variable costs, indicating no net loss or gain. Gross profit quantifies profit margin effectiveness, whereas break-even revenue highlights the sales threshold for avoiding losses. Understanding these distinctions is crucial for financial planning, pricing strategies, and business sustainability analysis.
How to Calculate Gross Profit Step-by-Step
To calculate gross profit, first determine total revenue by multiplying the selling price per unit by the number of units sold. Next, calculate the cost of goods sold (COGS) by adding direct costs like materials and labor involved in production. Subtract COGS from total revenue to obtain gross profit, which reflects the company's profitability before accounting for operating expenses.
Break-even Revenue Calculation: A Practical Guide
Break-even revenue calculation determines the minimum sales needed to cover total fixed and variable costs without incurring a loss. To calculate break-even revenue, divide total fixed costs by the contribution margin ratio, which is the percentage of each sales dollar remaining after variable costs. Understanding this calculation empowers businesses to set realistic sales targets and manage profitability effectively.
Factors Affecting Gross Profit and Break-even Revenue
Gross profit is influenced by factors such as cost of goods sold (COGS), pricing strategies, and sales volume, while break-even revenue depends on fixed costs, variable costs, and profit margins. Changes in production efficiency, supplier pricing, and sales mix directly impact gross profit margins and the level of revenue required to cover all expenses. Understanding the relationship between cost structure and pricing aids in accurately determining break-even points and optimizing gross profit performance.
The Role of Fixed and Variable Costs
Gross profit measures the difference between sales revenue and variable costs, providing insight into profitability before fixed costs are considered. Break-even revenue is the sales level at which total revenue equals total costs, including both fixed and variable expenses, resulting in zero profit. Understanding the impact of fixed costs, such as rent and salaries, alongside variable costs like raw materials, is crucial for accurately calculating break-even points and optimizing gross profit margins.
Impacts on Business Decision-Making
Gross profit provides crucial insights into a company's profitability by measuring revenue minus the cost of goods sold, guiding pricing strategies and cost control decisions. Break-even revenue indicates the minimum sales required to cover fixed and variable costs, helping businesses determine sales targets and evaluate risk levels. Understanding the relationship between gross profit and break-even revenue enables informed decisions on resource allocation, budgeting, and scaling operations to achieve sustainable growth.
Common Mistakes in Gross Profit and Break-even Analysis
Common mistakes in gross profit and break-even analysis often include overlooking variable costs when calculating gross profit, leading to an inflated profit margin. Misinterpreting break-even revenue by not factoring in fixed costs or changes in sales volume results in inaccurate threshold identification. Failing to update cost assumptions with real-time data can skew both gross profit estimations and break-even points, compromising financial decision-making.
Maximizing Profitability: Strategies Beyond Break-even
Maximizing profitability requires analyzing gross profit margins to identify cost-saving opportunities and pricing strategies that exceed the break-even revenue threshold. Implementing targeted marketing and operational efficiencies enhances sales volume while reducing variable and fixed costs, pushing revenue well beyond break-even points. Continuous monitoring of financial metrics, such as contribution margin and overhead allocation, supports sustainable profit growth and strategic decision-making.
Gross Profit Infographic