EPS (Earnings Per Share) measures a company's profitability on a per-share basis, indicating how much profit is allocated to each outstanding share. The P/E Ratio (Price-to-Earnings Ratio) compares a company's current stock price to its EPS, reflecting market expectations and valuation. Explore the full article to understand how these metrics impact your investment decisions.
Table of Comparison
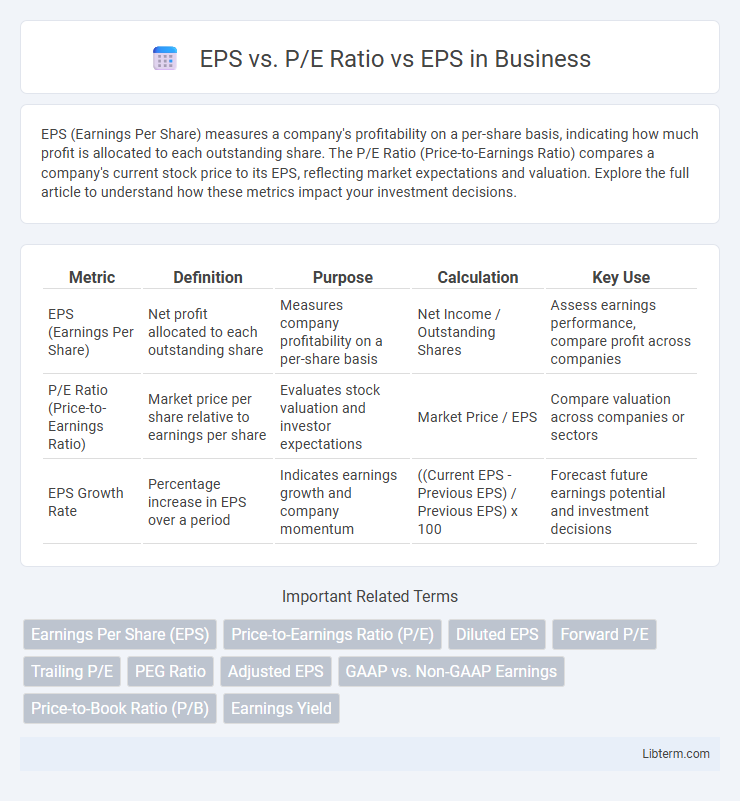
| Metric | Definition | Purpose | Calculation | Key Use |
|---|---|---|---|---|
| EPS (Earnings Per Share) | Net profit allocated to each outstanding share | Measures company profitability on a per-share basis | Net Income / Outstanding Shares | Assess earnings performance, compare profit across companies |
| P/E Ratio (Price-to-Earnings Ratio) | Market price per share relative to earnings per share | Evaluates stock valuation and investor expectations | Market Price / EPS | Compare valuation across companies or sectors |
| EPS Growth Rate | Percentage increase in EPS over a period | Indicates earnings growth and company momentum | ((Current EPS - Previous EPS) / Previous EPS) x 100 | Forecast future earnings potential and investment decisions |
Introduction to EPS and P/E Ratio
Earnings Per Share (EPS) measures a company's profitability by dividing net income by the number of outstanding shares, providing insight into individual share earnings. The Price-to-Earnings (P/E) ratio compares a company's current share price to its EPS, indicating market expectations of future growth and valuation. EPS reflects actual company performance, while the P/E ratio offers a relative measure for evaluating stock price attractiveness.
Understanding Earnings Per Share (EPS)
Earnings Per Share (EPS) measures a company's profitability allocated to each outstanding share of common stock, calculated by dividing net income minus dividends on preferred stock by the average outstanding shares. The Price-to-Earnings (P/E) ratio compares the current share price to EPS, indicating market expectations about future earnings growth and valuation. Understanding EPS is crucial for investors as it provides insight into a company's financial health and serves as a foundation for evaluating the P/E ratio and making informed investment decisions.
What is the Price-to-Earnings (P/E) Ratio?
The Price-to-Earnings (P/E) ratio measures a company's current share price relative to its earnings per share (EPS), indicating how much investors are willing to pay for each dollar of earnings. A high P/E ratio often reflects expectations of future growth, while a low P/E may suggest undervaluation or potential issues. Understanding the P/E ratio aids in evaluating stock valuation compared to earnings performance.
Key Differences Between EPS and P/E Ratio
EPS (Earnings Per Share) measures a company's profitability by dividing net income by the number of outstanding shares, reflecting actual earnings performance. The P/E Ratio (Price-to-Earnings) compares the stock price to EPS, indicating market expectations and valuation relative to earnings. Key differences include that EPS shows absolute earnings, while the P/E ratio assesses how much investors are willing to pay per dollar of earnings.
How EPS Reflects Company Profitability
Earnings Per Share (EPS) directly measures a company's profitability by showing the net income allocated to each outstanding share, providing investors with a clear indicator of financial performance. The Price-to-Earnings (P/E) ratio, calculated by dividing the stock price by EPS, offers insight into market valuation relative to earnings, but EPS itself reflects actual profit generation. Higher EPS signifies stronger company profitability, influencing investor decisions and comparison across industry peers.
How P/E Ratio Measures Market Valuation
The Price-to-Earnings (P/E) ratio measures market valuation by comparing a company's stock price to its earnings per share (EPS), indicating how much investors are willing to pay for each dollar of earnings. A high P/E ratio suggests expectations of future growth, while a low P/E may indicate undervaluation or potential risk. EPS represents the company's profitability on a per-share basis, serving as the denominator in the P/E calculation and directly impacting its value.
EPS Calculation Methods and Examples
EPS (Earnings Per Share) is calculated by dividing net income minus dividends on preferred stock by the weighted average number of outstanding common shares. The P/E (Price-to-Earnings) Ratio compares a company's current share price to its EPS, reflecting market expectations of future earnings growth. For example, if a company has a net income of $1 million, pays $100,000 in preferred dividends, and has 500,000 shares outstanding, its EPS is ($1,000,000 - $100,000) / 500,000 = $1.80, making the P/E ratio meaningful when contextualized with stock price.
Interpreting P/E Ratio in Stock Analysis
The P/E ratio, calculated by dividing a stock's current price by its EPS, serves as a critical indicator of market expectations about a company's future earnings growth. A high P/E ratio often signals investor confidence in robust earnings potential, while a low P/E may indicate undervaluation or market skepticism. Interpreting the P/E ratio requires context, including industry benchmarks and growth rates, to accurately assess whether a stock is overvalued or undervalued relative to its earnings performance.
EPS vs. P/E Ratio: Which Is More Important?
EPS (Earnings Per Share) measures a company's profitability on a per-share basis, while the P/E Ratio (Price-to-Earnings Ratio) compares the stock price relative to earnings, reflecting investor expectations. Investors often prioritize the P/E Ratio because it provides insight into market valuation and future growth potential, whereas EPS shows absolute earning power. Assessing both metrics together offers a balanced view, but the P/E Ratio is typically more important for evaluating stock attractiveness and market sentiment.
Practical Tips for Using EPS and P/E Ratio in Investment Decisions
Earnings Per Share (EPS) measures a company's profitability on a per-share basis, providing insight into financial health, while the Price-to-Earnings (P/E) ratio relates stock price to EPS, indicating market expectations and valuation. Investors should compare EPS growth trends alongside P/E ratios to identify undervalued stocks with strong earnings potential, avoiding stocks with high P/E ratios but stagnant EPS. Practical use involves analyzing industry benchmarks, considering cyclical factors, and combining EPS and P/E analysis with broader financial metrics for informed investment decisions.
EPS vs. P/E Ratio Infographic