Earnings Per Share (EPS) measures the profitability on a per-share basis, giving investors insight into how much profit each share generates. Return on Equity (ROE) evaluates how effectively a company uses shareholders' equity to generate net income, reflecting management efficiency and financial health. Explore the detailed comparison to understand how these key financial metrics impact your investment decisions.
Table of Comparison
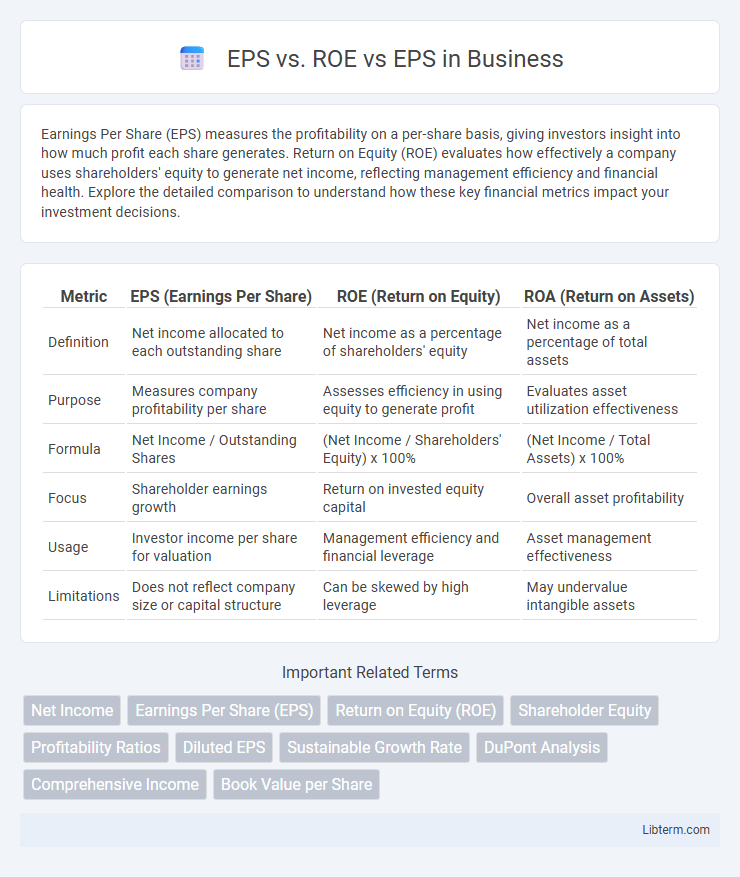
| Metric | EPS (Earnings Per Share) | ROE (Return on Equity) | ROA (Return on Assets) |
|---|---|---|---|
| Definition | Net income allocated to each outstanding share | Net income as a percentage of shareholders' equity | Net income as a percentage of total assets |
| Purpose | Measures company profitability per share | Assesses efficiency in using equity to generate profit | Evaluates asset utilization effectiveness |
| Formula | Net Income / Outstanding Shares | (Net Income / Shareholders' Equity) x 100% | (Net Income / Total Assets) x 100% |
| Focus | Shareholder earnings growth | Return on invested equity capital | Overall asset profitability |
| Usage | Investor income per share for valuation | Management efficiency and financial leverage | Asset management effectiveness |
| Limitations | Does not reflect company size or capital structure | Can be skewed by high leverage | May undervalue intangible assets |
Introduction to EPS and ROE
Earnings Per Share (EPS) measures a company's profitability by dividing net income by outstanding shares, providing insight into individual share value. Return on Equity (ROE) indicates financial performance by assessing net income relative to shareholder equity, reflecting efficiency in generating profits from investments. Both metrics are critical for investors evaluating company profitability and risk, with EPS focusing on per-share earnings and ROE highlighting overall equity efficiency.
Defining Earnings Per Share (EPS)
Earnings Per Share (EPS) measures the net profit allocated to each outstanding share of common stock, serving as a key indicator of a company's profitability. Return on Equity (ROE) quantifies the efficiency of generating profits from shareholders' equity, reflecting overall financial performance. EPS specifically highlights the profit available to shareholders on a per-share basis, providing direct insight into earnings growth and company valuation.
Understanding Return on Equity (ROE)
Return on Equity (ROE) measures a company's profitability by revealing how much profit it generates with shareholders' equity, providing insight into financial efficiency compared to Earnings Per Share (EPS), which indicates net income allocated to each outstanding share. ROE is a key indicator for investors assessing management effectiveness in using equity capital to grow earnings, while EPS reflects the company's profitability on a per-share basis. Analyzing both ROE and EPS together offers a comprehensive view of a firm's financial health and growth potential.
How EPS is Calculated
Earnings Per Share (EPS) is calculated by dividing net income minus preferred dividends by the weighted average number of outstanding common shares during a specific period. Return on Equity (ROE) measures net income as a percentage of shareholders' equity, highlighting overall profitability relative to invested capital. Unlike ROE, EPS directly reflects profitability on a per-share basis, making it crucial for assessing shareholder value.
ROE Calculation Explained
Return on Equity (ROE) is calculated by dividing net income by shareholders' equity, providing a clear measure of a company's profitability relative to equity invested by shareholders. Unlike Earnings Per Share (EPS), which shows net income allocated per share, ROE offers insight into how effectively management uses equity to generate profits. Investors rely on ROE to assess financial efficiency and compare performance across firms within the same industry.
Key Differences Between EPS and ROE
Earnings Per Share (EPS) measures the net profit allocated to each outstanding share, reflecting a company's profitability on a per-share basis, while Return on Equity (ROE) assesses overall financial performance by indicating how efficiently a company uses shareholders' equity to generate profit. EPS provides insight into shareholder value in terms of earnings per share, whereas ROE evaluates management effectiveness in utilizing invested capital. The key difference lies in EPS focusing on earnings relative to shares outstanding, and ROE emphasizing return generated from shareholders' equity.
EPS vs. ROE: Which Metric Matters More?
Earnings Per Share (EPS) measures a company's profitability on a per-share basis, reflecting net income allocated to each outstanding share, while Return on Equity (ROE) indicates how efficiently management uses shareholders' equity to generate profits. EPS is crucial for assessing direct shareholder returns and is often prioritized by investors focused on stock price appreciation and dividends. ROE provides insights into management effectiveness and sustainable growth potential, making it vital for evaluating long-term value creation.
Pros and Cons of Using EPS
Earnings Per Share (EPS) provides a straightforward measure of a company's profitability on a per-share basis, making it useful for comparing earnings across firms with different share counts. However, EPS can be misleading due to its susceptibility to manipulation through share buybacks or changes in net income, potentially obscuring true operational performance. Unlike Return on Equity (ROE), which indicates how effectively shareholder equity is used to generate profits, EPS does not account for capital structure, making ROE a more comprehensive profitability metric in some cases.
Advantages and Limitations of ROE
Return on Equity (ROE) measures a company's profitability by revealing how much profit is generated with shareholders' equity, providing insight into management efficiency. Its advantages include assessing financial leverage and identifying high return on invested capital, but limitations arise from its sensitivity to debt levels and potential distortion by share buybacks. Unlike Earnings Per Share (EPS), which focuses on profitability per share, ROE offers a broader view of overall equity performance but can mislead if analyzed without considering capital structure.
Conclusion: Choosing the Right Financial Metric
Selecting the appropriate financial metric depends on the specific analysis goal: EPS highlights company profitability per share, crucial for investors assessing earnings growth, while ROE measures efficiency in generating returns from shareholder equity, vital for evaluating management effectiveness. EPS provides a direct indication of earnings performance, but ROE offers insight into asset utilization and financial leverage impacts. Optimal financial assessment combines both metrics to gain a comprehensive view of profitability and operational efficiency.
EPS vs. ROE Infographic