Churn rate measures the percentage of customers who stop using a service during a specific period, serving as a key indicator of business health and customer satisfaction. Understanding your churn rate helps identify retention challenges and opportunities to enhance customer loyalty. Explore the rest of the article to learn effective strategies for reducing churn and boosting your business growth.
Table of Comparison
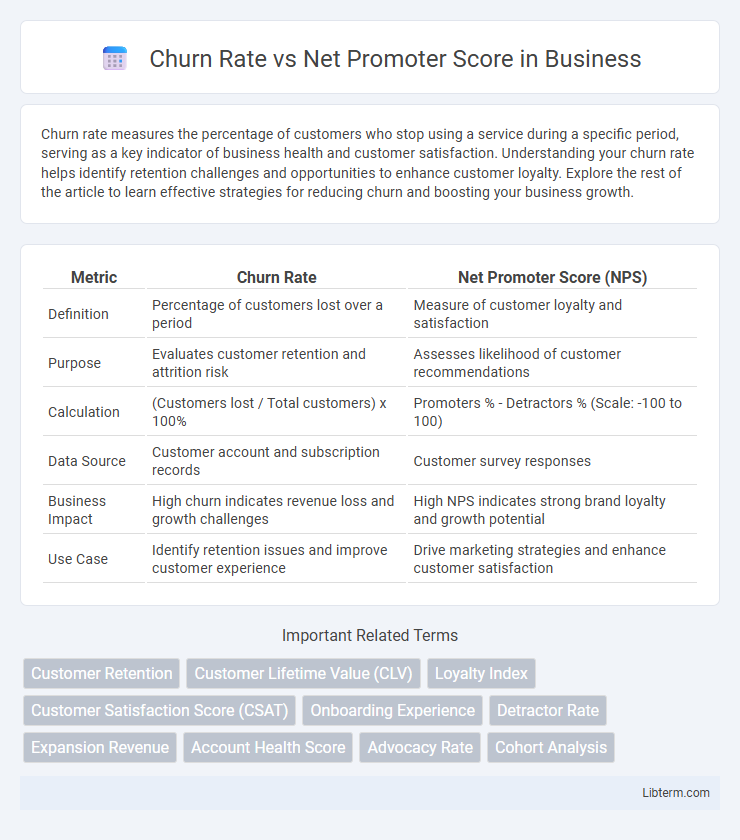
| Metric | Churn Rate | Net Promoter Score (NPS) |
|---|---|---|
| Definition | Percentage of customers lost over a period | Measure of customer loyalty and satisfaction |
| Purpose | Evaluates customer retention and attrition risk | Assesses likelihood of customer recommendations |
| Calculation | (Customers lost / Total customers) x 100% | Promoters % - Detractors % (Scale: -100 to 100) |
| Data Source | Customer account and subscription records | Customer survey responses |
| Business Impact | High churn indicates revenue loss and growth challenges | High NPS indicates strong brand loyalty and growth potential |
| Use Case | Identify retention issues and improve customer experience | Drive marketing strategies and enhance customer satisfaction |
Understanding Churn Rate: Definition and Importance
Churn rate measures the percentage of customers who stop using a product or service within a specific time frame, providing critical insight into customer retention and business health. A high churn rate indicates potential issues with customer satisfaction, product value, or competitive pressure, making it essential for companies to track and analyze churn to reduce lost revenue. Understanding churn rate helps businesses implement targeted strategies to improve customer loyalty and inform decisions that enhance overall growth and profitability.
What is Net Promoter Score (NPS)?
Net Promoter Score (NPS) measures customer loyalty by asking how likely customers are to recommend a brand on a scale from 0 to 10, categorizing respondents into Promoters, Passives, and Detractors. NPS is calculated by subtracting the percentage of Detractors from the percentage of Promoters, providing a clear metric of overall customer satisfaction. Companies use NPS to predict churn rate and identify opportunities for improving customer retention and loyalty.
Key Differences Between Churn Rate and NPS
Churn Rate measures the percentage of customers who stop using a service over a specific period, reflecting customer retention and business health. Net Promoter Score (NPS) quantifies customer loyalty by asking how likely customers are to recommend a brand, scoring from -100 to 100. While Churn Rate focuses on actual customer loss, NPS captures potential customer advocacy and satisfaction, offering predictive insights into future retention.
How Churn Rate Reflects Customer Retention
Churn rate quantifies the percentage of customers who discontinue using a product or service over a specific period, directly indicating customer retention levels. A low churn rate signifies high customer retention and loyalty, while a high churn rate signals potential issues in customer satisfaction or product value. Unlike Net Promoter Score (NPS), which measures customer advocacy and likelihood to recommend, churn rate provides a concrete metric for actual retention performance and revenue stability.
Measuring Customer Satisfaction with NPS
Net Promoter Score (NPS) provides a direct measure of customer satisfaction by quantifying the likelihood of customers recommending a product or service, making it a critical metric for understanding loyalty. Unlike churn rate, which tracks the percentage of customers lost over a period, NPS captures customer sentiment at a given moment, offering actionable insights for improving the customer experience. Companies leveraging NPS data can identify promoters and detractors, enabling targeted strategies to boost satisfaction and reduce future churn.
Correlation Between Churn Rate and NPS
A strong inverse correlation exists between Churn Rate and Net Promoter Score (NPS), where higher NPS values typically indicate lower customer churn. Companies with elevated NPS scores often experience increased customer loyalty, leading to reduced churn rates and enhanced long-term revenue. Monitoring this relationship enables businesses to predict customer retention trends and implement targeted strategies for improving overall customer satisfaction.
Factors Influencing Churn Rate and NPS
Churn Rate is primarily influenced by customer satisfaction, product quality, and competitive pricing, which directly impact customer retention and loyalty. Net Promoter Score (NPS) reflects customers' willingness to recommend a brand, driven by factors like service experience, brand trust, and perceived value. Both metrics are interrelated, as improvements in NPS often lead to lower churn rates by enhancing customer advocacy and reducing dissatisfaction.
Strategies to Reduce Churn Rate Using NPS Insights
Analyzing Net Promoter Score (NPS) insights helps businesses identify detractors and address their concerns to reduce churn rate effectively. Implementing targeted improvements based on NPS feedback enhances customer satisfaction and loyalty, decreasing the likelihood of customer attrition. Leveraging NPS data for proactive engagement allows companies to tailor retention strategies, transforming promoters into brand advocates and minimizing churn.
Interpreting Churn Rate vs NPS in Business Decisions
Churn Rate measures customer attrition, directly impacting revenue stability and highlighting retention challenges, while Net Promoter Score (NPS) gauges customer loyalty and likelihood of brand advocacy, influencing growth potential. Analyzing both metrics helps businesses identify whether dissatisfaction or lack of enthusiasm drives customer loss, enabling targeted strategies to improve retention and enhance customer experience. Interpreting Churn Rate alongside NPS guides data-driven decisions to optimize marketing, product development, and customer service initiatives.
Best Practices for Monitoring Churn Rate and NPS
Effective monitoring of Churn Rate and Net Promoter Score (NPS) requires consistent data collection through customer feedback surveys and transactional analysis. Implement segmentation to identify at-risk customer groups and tailor retention strategies based on NPS insights linked to churn patterns. Leverage predictive analytics and real-time dashboards to track trends, enabling proactive intervention and continuous improvement in customer loyalty and satisfaction metrics.
Churn Rate Infographic