The traditional Phillips curve illustrates the inverse relationship between unemployment and inflation, suggesting that lower unemployment rates tend to coincide with higher inflation. This economic model helps in understanding how labor market dynamics influence price levels and wage growth. Explore the rest of the article to uncover how this relationship has evolved and its implications for Your economic decisions.
Table of Comparison
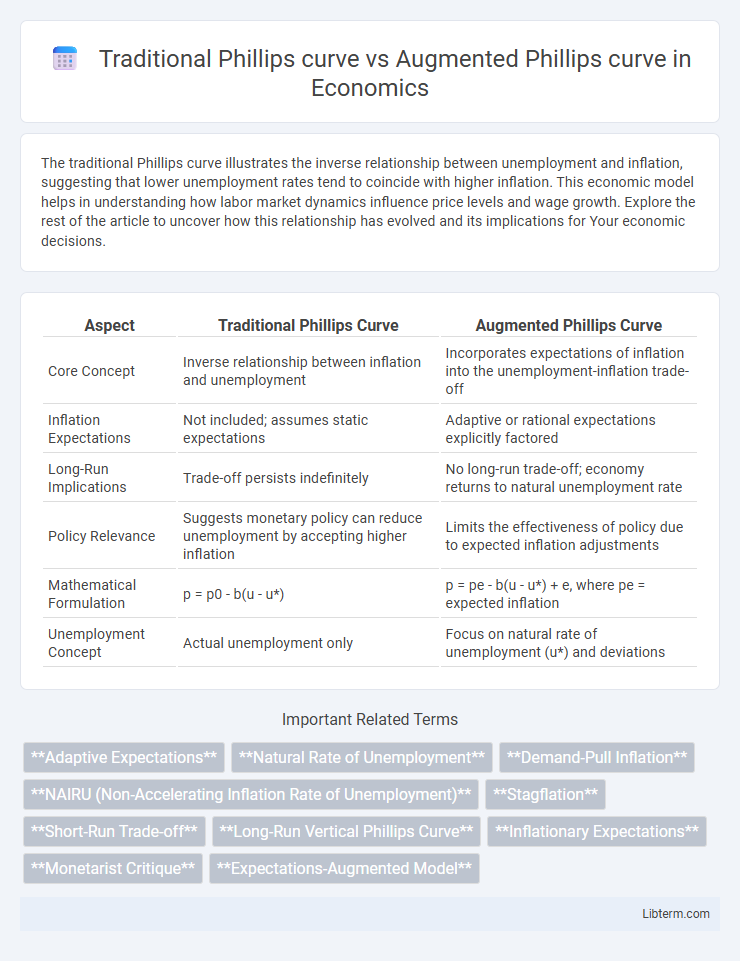
| Aspect | Traditional Phillips Curve | Augmented Phillips Curve |
|---|---|---|
| Core Concept | Inverse relationship between inflation and unemployment | Incorporates expectations of inflation into the unemployment-inflation trade-off |
| Inflation Expectations | Not included; assumes static expectations | Adaptive or rational expectations explicitly factored |
| Long-Run Implications | Trade-off persists indefinitely | No long-run trade-off; economy returns to natural unemployment rate |
| Policy Relevance | Suggests monetary policy can reduce unemployment by accepting higher inflation | Limits the effectiveness of policy due to expected inflation adjustments |
| Mathematical Formulation | p = p0 - b(u - u*) | p = pe - b(u - u*) + e, where pe = expected inflation |
| Unemployment Concept | Actual unemployment only | Focus on natural rate of unemployment (u*) and deviations |
Introduction to the Phillips Curve
The Traditional Phillips curve illustrates an inverse relationship between inflation and unemployment, suggesting lower unemployment rates come with higher inflation due to wage pressures. The Augmented Phillips curve incorporates inflation expectations, showing that the trade-off between inflation and unemployment depends on anticipated inflation, reflecting adaptive or rational expectations. This augmented model emphasizes the role of expectations in shaping wage-setting and price-setting behavior, making the Phillips curve more consistent with observed economic dynamics.
Historical Background of the Traditional Phillips Curve
The Traditional Phillips Curve, introduced by A.W. Phillips in 1958, empirically demonstrated an inverse relationship between unemployment and wage inflation in the UK from 1861 to 1957. It provided policymakers with a framework to understand the trade-off between inflation and unemployment during the post-war economic expansion. This early model influenced macroeconomic policy before the rise of expectations-augmented versions that incorporate inflation expectations and supply shocks.
Key Assumptions of the Traditional Phillips Curve
The Traditional Phillips Curve assumes a stable inverse relationship between unemployment and inflation, suggesting policymakers can exploit this trade-off in the short run. It presumes constant inflation expectations, implying that changes in inflation are primarily driven by shifts in unemployment rather than by adaptive or rational expectations. This model does not account for supply shocks or the natural rate of unemployment, limiting its long-term applicability.
Limitations of the Traditional Phillips Curve
The Traditional Phillips Curve illustrates an inverse relationship between unemployment and inflation but fails to account for expectations, leading to inaccurate long-term predictions. It overlooks the role of adaptive or rational inflation expectations, causing its inability to explain stagflation phenomena during the 1970s. The Augmented Phillips Curve integrates inflation expectations and supply shocks, addressing the limitations by providing a more dynamic model of inflation-unemployment interactions.
Emergence of the Augmented Phillips Curve
The Traditional Phillips Curve illustrates an inverse relationship between unemployment and inflation, implying stable trade-offs in the short run. The Augmented Phillips Curve emerged to address the role of inflation expectations and supply shocks, incorporating adaptive or rational expectations that shift the curve, thereby explaining persistent inflation despite high unemployment. This evolution highlights how the expectations-augmented framework integrates macroeconomic factors, refining the Phillips Curve's predictive power in dynamic economic environments.
Incorporating Expectations: The Role of Inflation
The traditional Phillips curve illustrates an inverse relationship between inflation and unemployment without accounting for inflation expectations, suggesting stable trade-offs. In contrast, the augmented Phillips curve integrates adaptive or rational expectations, showing that anticipated inflation shifts the curve, diminishing the trade-off and emphasizing the role of inflation expectations in wage-setting and price adjustments. Incorporating expectations explains why persistent inflation and unemployment can coexist, aligning with the expectations-augmented Phillips curve framework developed by economists like Friedman and Phelps.
Structural Differences Between Traditional and Augmented Phillips Curves
The traditional Phillips curve illustrates an inverse relationship between inflation and unemployment, assuming a stable trade-off without accounting for expectations. In contrast, the augmented Phillips curve incorporates adaptive or rational expectations, emphasizing the role of inflation expectations and supply shocks, which alter the trade-off dynamically. This structural difference reflects how the augmented model accounts for real factors such as changes in the natural rate of unemployment and inflation persistence, providing a more comprehensive framework for monetary policy analysis.
Policy Implications of Each Phillips Curve Variant
The Traditional Phillips curve suggests a stable inverse relationship between unemployment and inflation, implying policymakers can exploit this trade-off to reduce unemployment by accepting higher inflation. The Augmented Phillips curve incorporates inflation expectations, indicating that attempts to lower unemployment below the natural rate will only result in accelerating inflation without long-term gains. Therefore, policy implications shift towards managing inflation expectations and focusing on structural reforms rather than relying on demand-side stimulus to control unemployment.
Empirical Evidence and Real-World Applications
Empirical evidence on the Traditional Phillips curve shows a short-run inverse relationship between unemployment and inflation, but its predictive power weakens during periods of stagflation, as seen in the 1970s. The Augmented Phillips curve incorporates expectations of inflation and supply shocks, improving its empirical fit by accounting for adaptive or rational inflation expectations, which aligns better with observed inflation-unemployment dynamics in modern economies. Real-world applications favor the Augmented model for monetary policy decisions, as central banks use it to anticipate inflation behavior under varying unemployment rates and expectations, enhancing inflation targeting frameworks.
Conclusion: Comparative Insights on the Phillips Curve Debate
The Traditional Phillips curve posits a stable inverse relationship between inflation and unemployment, suggesting policymakers can exploit this trade-off in the short run. The Augmented Phillips curve incorporates expectations and supply shocks, emphasizing that this trade-off is temporary and highlighting the long-run vertical nature of the curve at the natural rate of unemployment. Empirical evidence supports the Augmented Phillips curve's view that adaptive or rational inflation expectations negate the long-term trade-off, guiding modern monetary policy toward targeting inflation without permanently lowering unemployment.
Traditional Phillips curve Infographic