A budget line represents all possible combinations of two goods that a consumer can purchase given their income and the prices of those goods, illustrating the trade-offs you face. It visually demonstrates how changes in income or prices impact your purchasing choices and overall consumption. Explore the rest of the article to understand how to use budget lines for smarter financial decisions.
Table of Comparison
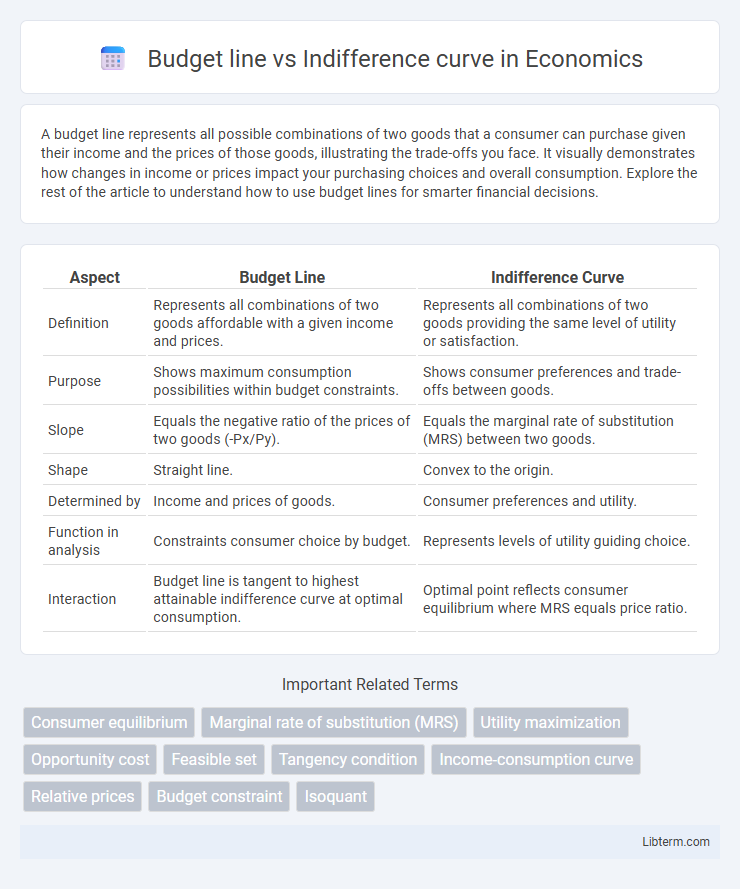
| Aspect | Budget Line | Indifference Curve |
|---|---|---|
| Definition | Represents all combinations of two goods affordable with a given income and prices. | Represents all combinations of two goods providing the same level of utility or satisfaction. |
| Purpose | Shows maximum consumption possibilities within budget constraints. | Shows consumer preferences and trade-offs between goods. |
| Slope | Equals the negative ratio of the prices of two goods (-Px/Py). | Equals the marginal rate of substitution (MRS) between two goods. |
| Shape | Straight line. | Convex to the origin. |
| Determined by | Income and prices of goods. | Consumer preferences and utility. |
| Function in analysis | Constraints consumer choice by budget. | Represents levels of utility guiding choice. |
| Interaction | Budget line is tangent to highest attainable indifference curve at optimal consumption. | Optimal point reflects consumer equilibrium where MRS equals price ratio. |
Introduction to Budget Line and Indifference Curve
A budget line represents all possible combinations of two goods that a consumer can purchase given their income and the prices of those goods, illustrating the consumer's purchasing power and constraints. An indifference curve depicts combinations of two goods between which a consumer is indifferent, reflecting constant utility or satisfaction across the curve. Understanding the budget line and indifference curve together allows analysis of consumer choice, where the optimal consumption point lies at the tangency between the budget line and the highest attainable indifference curve.
Defining the Budget Line
The budget line represents all possible combinations of two goods that a consumer can purchase given their income and the prices of those goods. It is defined by the equation I = P_xX + P_yY, where I is income, P_x and P_y are the prices of goods X and Y respectively, and X and Y are the quantities of those goods. The budget line illustrates the consumer's purchasing power and constraints, serving as a boundary for feasible consumption bundles in microeconomic analysis.
Understanding the Indifference Curve
The indifference curve represents all combinations of goods that provide equal satisfaction or utility to a consumer, illustrating preferences without reflecting income or prices directly. It is convex to the origin, indicating diminishing marginal rates of substitution between goods. Understanding indifference curves helps to analyze consumer choices and how they achieve maximum utility when combined with the budget line.
Key Assumptions of Both Concepts
The budget line assumes fixed income and constant prices, illustrating all possible consumption bundles affordable within a consumer's budget constraint. Indifference curves rely on assumptions of consumer preferences, including completeness, transitivity, and non-satiation, representing combinations of goods providing equal satisfaction. Both models presuppose rational behavior, where consumers aim to maximize utility subject to budget constraints.
Mathematical Representation
The budget line is mathematically expressed as \( P_xX + P_yY = I \), where \( P_x \) and \( P_y \) are the prices of goods \( X \) and \( Y \), respectively, and \( I \) is the consumer's income, representing all combinations of goods affordable given the budget. The indifference curve is defined by the utility function \( U(X,Y) = k \), where \( k \) is a constant level of utility, illustrating combinations of goods \( X \) and \( Y \) that provide equal satisfaction to the consumer. These mathematical representations highlight the budget line's constraint role and the indifference curve's utility optimization in consumer choice theory.
Graphical Illustration and Differences
The budget line represents all combinations of two goods that a consumer can afford given their income and prices, illustrated as a straight line with a slope equal to the negative ratio of the goods' prices. Indifference curves depict consumer preferences, showing combinations of goods that provide equal satisfaction, represented as convex curves bending inward toward the origin. The key difference lies in the budget line reflecting economic constraints, while indifference curves convey subjective utility, and their intersection determines the optimal consumer choice.
Points of Equilibrium: Where They Meet
Points of equilibrium occur where the budget line tangentially touches the highest attainable indifference curve, representing optimal consumer choice. At this juncture, the marginal rate of substitution (MRS) equals the ratio of the goods' prices, indicating maximum utility given budget constraints. This balance point reflects consumers maximizing satisfaction without exceeding their budget.
Effects of Income and Price Changes
Budget lines shift outward when income increases, allowing consumers to afford more combinations of goods, whereas price changes alter the slope of the budget line, reflecting the new relative prices. Indifference curves represent consumer preferences, with any movement to higher curves indicating increased utility due to income effects, while changes in slope relate to substitution effects caused by price variations. Understanding these shifts helps analyze consumer choice and how income and price changes impact demand patterns.
Real-World Applications in Consumer Behavior
Budget lines represent the combinations of goods consumers can afford given their income and prices, while indifference curves illustrate consumer preferences and the trade-offs they are willing to make between different goods. In real-world consumer behavior, these concepts help businesses and policymakers predict how changes in income or prices influence purchasing decisions and market demand. Understanding the interaction between budget constraints and consumer preferences enables more accurate forecasting of responses to economic policies, price fluctuations, and income variations.
Conclusion: Comparing Budget Line and Indifference Curve
The budget line represents all possible combinations of goods a consumer can afford given their income and prices, while the indifference curve illustrates combinations of goods providing equal satisfaction or utility. Comparing the two highlights that the optimal consumer choice occurs at the point where the budget line tangentially touches the highest attainable indifference curve, maximizing utility within budget constraints. Understanding this intersection clarifies how consumers allocate resources efficiently under given economic conditions.
Budget line Infographic