An indifference curve represents a graphical depiction of different combinations of two goods that provide the same level of satisfaction to a consumer, reflecting their preferences and trade-offs. It is a fundamental concept in microeconomics, illustrating consumer behavior without specifying the exact utility values. Explore the rest of the article to understand how indifference curves influence decision-making and market equilibrium.
Table of Comparison
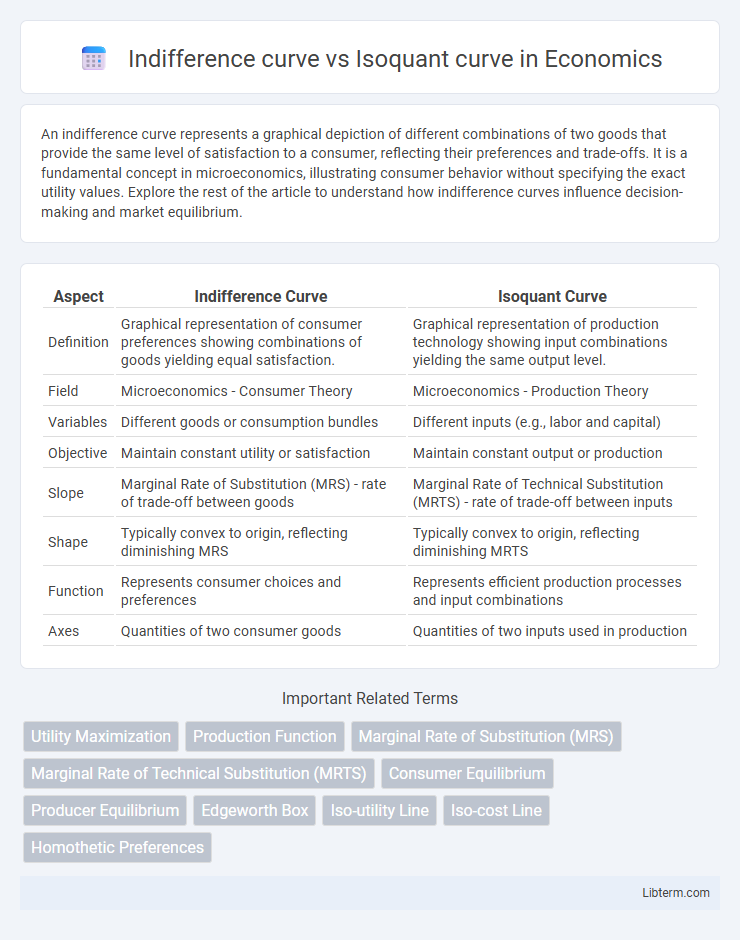
| Aspect | Indifference Curve | Isoquant Curve |
|---|---|---|
| Definition | Graphical representation of consumer preferences showing combinations of goods yielding equal satisfaction. | Graphical representation of production technology showing input combinations yielding the same output level. |
| Field | Microeconomics - Consumer Theory | Microeconomics - Production Theory |
| Variables | Different goods or consumption bundles | Different inputs (e.g., labor and capital) |
| Objective | Maintain constant utility or satisfaction | Maintain constant output or production |
| Slope | Marginal Rate of Substitution (MRS) - rate of trade-off between goods | Marginal Rate of Technical Substitution (MRTS) - rate of trade-off between inputs |
| Shape | Typically convex to origin, reflecting diminishing MRS | Typically convex to origin, reflecting diminishing MRTS |
| Function | Represents consumer choices and preferences | Represents efficient production processes and input combinations |
| Axes | Quantities of two consumer goods | Quantities of two inputs used in production |
Introduction to Indifference Curve and Isoquant Curve
Indifference curves represent combinations of two goods that provide equal satisfaction or utility to a consumer, illustrating consumer preferences and substitution effects in microeconomics. Isoquant curves depict different combinations of inputs, such as labor and capital, producing the same level of output in production theory, highlighting the technical substitutability of inputs. Both curves serve as essential tools in economic analysis for decision-making under constraints, with indifference curves focusing on consumer behavior and isoquants emphasizing producer behavior.
Definition of Indifference Curve
Indifference curves represent combinations of two goods that yield equivalent satisfaction or utility to a consumer, illustrating consumer preferences without involving production factors. Isoquant curves depict combinations of different inputs, such as labor and capital, that produce the same output level in production theory. The fundamental difference lies in indifference curves analyzing consumer behavior while isoquants focus on producer input combinations.
Definition of Isoquant Curve
An isoquant curve represents combinations of different inputs, such as labor and capital, that produce the same level of output in production theory. Unlike indifference curves that reflect consumer preferences and utility, isoquants are used to analyze production efficiency and input substitution. Isoquants are typically convex to the origin, illustrating diminishing marginal rates of technical substitution between inputs.
Key Differences Between Indifference Curve and Isoquant Curve
Indifference curves represent consumer preferences by illustrating combinations of two goods that yield the same level of utility, while isoquant curves depict combinations of inputs, such as labor and capital, that produce the same level of output in production. Indifference curves slope downward due to the trade-off between goods, maintaining constant satisfaction, whereas isoquant curves reflect the substitutability of inputs to maintain consistent production levels. Unlike indifference curves that focus on consumer behavior, isoquant curves are used in microeconomics to analyze the efficiency of production processes and input allocation.
Underlying Assumptions of Each Curve
Indifference curves assume consumers have consistent preferences, non-satiation, and convex preferences leading to diminishing marginal rates of substitution, representing combinations of goods yielding equal utility. Isoquant curves assume firms aim for efficient production with constant technology, perfect divisibility of inputs, and diminishing marginal rates of technical substitution, representing combinations of inputs producing the same output level. Both curves rely on continuous, smooth, and convex representations but differ in application: utility maximization for indifference curves and output maximization for isoquants.
Graphical Representation: Indifference vs Isoquant Curves
Indifference curves graphically represent combinations of two goods that provide equal utility to a consumer, typically convex to the origin to reflect diminishing marginal rates of substitution. Isoquant curves illustrate combinations of two inputs, such as labor and capital, that produce the same level of output, also convex due to the diminishing marginal rate of technical substitution. Both curves do not intersect themselves and slope downward, but indifference curves pertain to consumer preferences while isoquants relate to production technology.
Economic Interpretation and Applications
Indifference curves represent combinations of two goods providing equal satisfaction to a consumer, reflecting preferences and utility maximization in consumer theory. Isoquant curves depict combinations of inputs, such as labor and capital, yielding the same level of output, essential for analyzing production efficiency in firm behavior. Both tools guide optimal decision-making: indifference curves inform consumption choices, while isoquants optimize resource allocation in production processes.
Marginal Rate: Substitution vs Technical Substitution
The marginal rate of substitution (MRS) in an indifference curve represents the rate at which a consumer is willing to trade one good for another while maintaining the same level of utility, reflecting preferences and subjective value. In contrast, the marginal rate of technical substitution (MRTS) along an isoquant curve indicates the rate at which one input can be substituted for another in production without changing output levels, emphasizing technological and production efficiency. Both MRS and MRTS measure trade-offs but differ fundamentally in their context--consumer choice versus production processes.
Practical Examples: Consumption vs Production
Indifference curves represent combinations of goods providing equal satisfaction to consumers, such as choosing between different bundles of coffee and tea to maintain the same utility level. Isoquant curves illustrate combinations of production inputs, like labor and capital, that result in the same output volume in manufacturing settings. Practical examples highlight consumer decisions in allocation of spending versus producer strategies in input substitution to optimize production efficiency.
Conclusion: Choosing the Right Curve for Economic Analysis
Indifference curves are ideal for analyzing consumer preferences and utility maximization by illustrating combinations of goods that yield equal satisfaction. Isoquant curves are essential for examining production efficiency, showing various input combinations that produce the same output level. Selecting the appropriate curve depends on whether the focus is consumer choice or production optimization within economic analysis.
Indifference curve Infographic