The Phillips curve illustrates the inverse relationship between unemployment and inflation, suggesting that lower unemployment rates often come with higher inflation. Understanding this trade-off is crucial for policymakers aiming to balance economic growth without overheating the economy. Dive into the article to explore how this concept impacts your economic environment and decision-making.
Table of Comparison
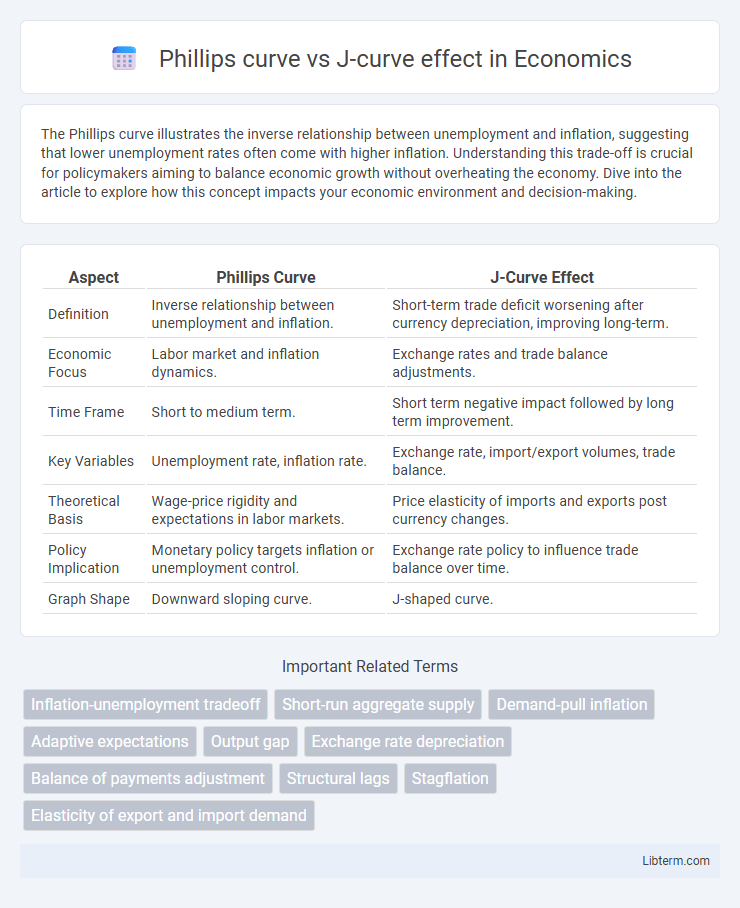
| Aspect | Phillips Curve | J-Curve Effect |
|---|---|---|
| Definition | Inverse relationship between unemployment and inflation. | Short-term trade deficit worsening after currency depreciation, improving long-term. |
| Economic Focus | Labor market and inflation dynamics. | Exchange rates and trade balance adjustments. |
| Time Frame | Short to medium term. | Short term negative impact followed by long term improvement. |
| Key Variables | Unemployment rate, inflation rate. | Exchange rate, import/export volumes, trade balance. |
| Theoretical Basis | Wage-price rigidity and expectations in labor markets. | Price elasticity of imports and exports post currency changes. |
| Policy Implication | Monetary policy targets inflation or unemployment control. | Exchange rate policy to influence trade balance over time. |
| Graph Shape | Downward sloping curve. | J-shaped curve. |
Introduction to Economic Curves
Economic curves such as the Phillips curve and the J-curve illustrate vital relationships in macroeconomics and international trade, respectively. The Phillips curve demonstrates the inverse relationship between inflation and unemployment rates, helping policymakers balance economic growth with price stability. The J-curve effect describes the initial deterioration followed by improvement in a country's trade balance following currency depreciation, reflecting short-term and long-term dynamics in international economics.
Defining the Phillips Curve
The Phillips Curve illustrates the inverse relationship between unemployment and inflation, suggesting that lower unemployment rates typically lead to higher inflation levels. This economic model highlights the trade-off policymakers face when stimulating economic growth, as reducing unemployment may cause wage and price increases. Understanding the Phillips Curve is crucial for analyzing inflation dynamics and formulating monetary policies aimed at balancing employment and price stability.
Explaining the J-Curve Effect
The J-Curve effect describes the phenomenon where a country's trade balance temporarily worsens following a currency depreciation before improving over time. Initially, the value of imports rises due to higher costs, while export volumes take time to respond to price changes because of existing contracts and adjustment lags. Over time, as export demand increases and import demand decreases, the trade balance moves upward, creating the characteristic "J" shaped trajectory on a graph.
Historical Context and Origins
The Phillips curve, first introduced by A.W. Phillips in 1958, emerged from empirical observations linking unemployment rates to wage inflation in the UK, highlighting a trade-off between inflation and unemployment. The J-curve effect, rooted in international trade theory, was formally described in the 1970s to explain the initial deterioration followed by improvement in a country's trade balance following currency depreciation. Both concepts originated during periods of economic shifts, reflecting evolving understandings of macroeconomic dynamics and international trade adjustments.
Key Variables Involved
The Phillips curve involves key variables such as inflation rate and unemployment rate, illustrating an inverse relationship where lower unemployment tends to increase inflation. The J-curve effect centers on exchange rates and trade balance, showing how a currency depreciation initially worsens the trade deficit before improving it over time as exports become more competitive. Understanding these variables is crucial for policymakers to balance inflation control and exchange rate adjustments.
Graphical Representation and Interpretation
The Phillips curve graphically depicts an inverse relationship between inflation and unemployment, typically sloping downward to illustrate that lower unemployment rates are associated with higher inflation. In contrast, the J-curve effect is represented on a time-based graph where a country's trade balance initially worsens following a currency depreciation before improving, forming a characteristic "J" shape. Interpreting these graphs provides insights into short-term trade-offs in macroeconomic policy (Phillips curve) versus the delayed response of trade balances to currency fluctuations (J-curve effect).
Contrasting Short-Run Dynamics
The Phillips curve depicts a short-run trade-off between inflation and unemployment, where decreasing unemployment leads to rising inflation due to increased demand pressures. In contrast, the J-curve effect describes the delayed improvement in a country's trade balance following currency depreciation, initially worsening before eventually improving as exports become more competitive. These contrasting short-run dynamics highlight immediate inflation-unemployment interactions versus lagged external sector adjustments.
Policy Implications and Applications
The Phillips curve suggests that policymakers face a trade-off between inflation and unemployment, guiding central banks to adjust interest rates to stabilize economic output without triggering high inflation. In contrast, the J-curve effect informs trade and currency policy by illustrating how a country's trade balance initially worsens after a currency depreciation before improving, prompting governments to consider timing and transition costs when implementing exchange rate adjustments. Understanding both curves helps policymakers design balanced monetary and fiscal strategies to achieve stable inflation, employment, and external balance over time.
Recent Empirical Evidence
Recent empirical evidence on the Phillips curve reveals a weakening inverse relationship between unemployment and inflation, suggesting inflation dynamics may be influenced more by expectations and supply shocks than by labor market slack. Studies on the J-curve effect demonstrate that currency devaluations initially worsen trade balances before subsequent improvements, with recent data showing variable recovery timelines depending on structural economic factors and trade elasticity. Cross-country analyses highlight that the J-curve's magnitude and duration differ significantly, influenced by globalization and monetary policy responses, while the Phillips curve's predictive power varies in low-inflation environments.
Conclusion: Comparative Insights
The Phillips curve highlights the inverse relationship between inflation and unemployment, while the J-curve effect describes the time lag in trade balance improvement following currency depreciation. Comparative insights reveal that the Phillips curve addresses short-term macroeconomic trade-offs, whereas the J-curve effect emphasizes dynamic adjustments in international trade flows. Understanding both concepts enhances policy decisions by balancing inflation control with external sector stability.
Phillips curve Infographic