The Lorenz curve graphically represents income or wealth distribution within a population, highlighting inequality by plotting cumulative shares of income against the population percentage. This curve helps identify disparities and assess economic fairness by comparing the actual distribution to perfect equality. Explore the full article to understand how the Lorenz curve offers insights into socioeconomic conditions and policy implications.
Table of Comparison
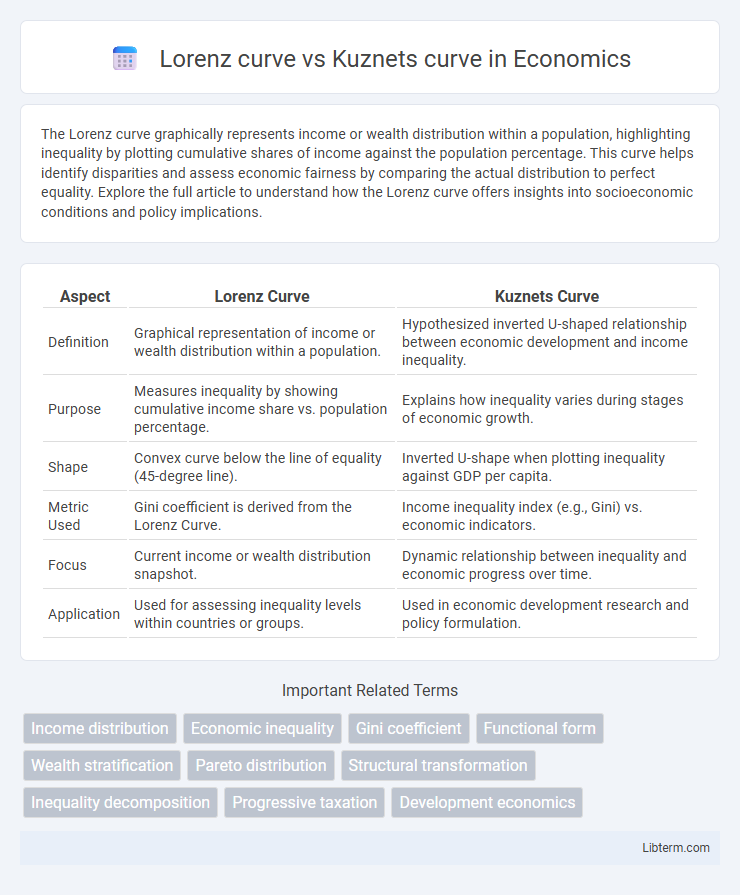
| Aspect | Lorenz Curve | Kuznets Curve |
|---|---|---|
| Definition | Graphical representation of income or wealth distribution within a population. | Hypothesized inverted U-shaped relationship between economic development and income inequality. |
| Purpose | Measures inequality by showing cumulative income share vs. population percentage. | Explains how inequality varies during stages of economic growth. |
| Shape | Convex curve below the line of equality (45-degree line). | Inverted U-shape when plotting inequality against GDP per capita. |
| Metric Used | Gini coefficient is derived from the Lorenz Curve. | Income inequality index (e.g., Gini) vs. economic indicators. |
| Focus | Current income or wealth distribution snapshot. | Dynamic relationship between inequality and economic progress over time. |
| Application | Used for assessing inequality levels within countries or groups. | Used in economic development research and policy formulation. |
Introduction to Lorenz Curve and Kuznets Curve
The Lorenz curve graphically represents income or wealth distribution within a population, illustrating inequality by plotting the cumulative percentage of total income against the cumulative percentage of recipients. The Kuznets curve hypothesizes an inverted U-shaped relationship between economic development and income inequality, suggesting that inequality initially rises and then falls as a country progresses economically. Both curves play a crucial role in analyzing socioeconomic disparities and guiding policy decisions aimed at equitable growth.
Historical Background and Development
The Lorenz curve, developed by Max O. Lorenz in 1905, was introduced to graphically represent income distribution and economic inequality within a population. The Kuznets curve, proposed by Simon Kuznets in the 1950s, hypothesizes an inverted U-shaped relationship between economic development and income inequality, suggesting inequality rises in early industrialization and falls in advanced economies. Both concepts have shaped the study of income distribution, with the Lorenz curve providing a foundational graphical tool and the Kuznets curve offering a dynamic hypothesis on economic growth and inequality trends.
Core Concepts: What Is the Lorenz Curve?
The Lorenz curve graphically represents income or wealth distribution within a population, illustrating inequality by plotting the cumulative percentage of total income earned against the cumulative percentage of recipients. It helps visualize disparity, where a perfectly equal distribution appears as a 45-degree line, and deviations indicate inequality levels. This curve is fundamental in economic analysis for assessing social justice and informing policy decisions regarding income redistribution.
Core Concepts: What Is the Kuznets Curve?
The Kuznets Curve illustrates the relationship between economic development and income inequality, suggesting that inequality first rises and then falls during industrialization phases. The Lorenz Curve graphically represents income distribution, depicting the proportion of total income earned by cumulative percentages of the population. While the Lorenz Curve measures inequality at a point in time, the Kuznets Curve describes the dynamic evolution of inequality over economic growth stages.
Visual Representation and Interpretation
The Lorenz curve visually represents income or wealth distribution within a population by plotting the cumulative percentage of total income earned against the cumulative percentage of recipients, with greater deviation from the line of equality indicating higher inequality. The Kuznets curve illustrates the relationship between economic development and income inequality, typically depicting an inverted U-shape where inequality initially rises and then declines as a country industrializes. While the Lorenz curve provides a snapshot of current inequality levels through graphical deviation, the Kuznets curve offers a broader dynamic interpretation of inequality trends over time relative to economic growth.
Measuring Income Inequality: Lorenz vs Kuznets
The Lorenz curve graphically represents income distribution by plotting the cumulative percentage of total income received against the cumulative percentage of recipients, offering a direct visualization of inequality within a population. The Kuznets curve hypothesizes an inverted U-shaped relationship between economic development and income inequality, suggesting that inequality rises during early growth phases and declines in later stages. While the Lorenz curve provides a snapshot of current income inequality, the Kuznets curve analyzes its dynamic evolution over time in relation to economic progress.
Strengths and Limitations of Each Curve
The Lorenz curve effectively illustrates income or wealth distribution, providing a clear visual of inequality within a population but lacks temporal context and does not explain causation. The Kuznets curve hypothesizes an inverted U-shaped relationship between economic development and inequality, highlighting dynamic changes over time, yet it relies on assumptions that may not hold universally and often oversimplifies complex socio-economic processes. Both curves offer valuable insights into inequality measurement and trends, with the Lorenz curve excelling in snapshot analysis and the Kuznets curve in illustrating economic development patterns, though each has inherent limitations in scope and interpretation.
Real-World Applications and Case Studies
The Lorenz curve is widely used in economics and social sciences to visualize income inequality within a population, serving as a foundational tool for policymakers assessing wealth distribution and social welfare programs. The Kuznets curve illustrates the relationship between economic development and income inequality, suggesting that inequality initially rises then falls as a country industrializes, which has been empirically tested in nations like the United States and China during their growth phases. Case studies in emerging economies reveal how the Lorenz curve informs targeted interventions, while the Kuznets curve guides long-term policy planning to balance growth and equity.
Policy Implications and Economic Insights
The Lorenz curve provides detailed visualization of income or wealth inequality, enabling policymakers to design targeted redistributive measures and assess social welfare programs' effectiveness. In contrast, the Kuznets curve suggests an inverted U-shaped relationship between economic development and inequality, guiding economic strategies to balance growth with equitable wealth distribution over time. Understanding both curves assists governments in crafting policies that mitigate inequality without stalling economic progress, ensuring sustainable and inclusive development.
Conclusion: Key Differences and Takeaways
The Lorenz curve illustrates income or wealth distribution within a population, emphasizing inequality levels, while the Kuznets curve hypothesizes an inverted U-shape relationship between economic development and inequality over time. The key difference lies in the Lorenz curve's static perspective on inequality distribution versus the Kuznets curve's dynamic view on how inequality evolves with growth. Understanding these distinctions aids policymakers in addressing inequality through targeted economic and social interventions.
Lorenz curve Infographic