The average propensity to consume (APC) measures the proportion of total income that households spend on consumption rather than saving. It helps analyze consumer behavior and the overall economic demand by indicating how much of each dollar earned is likely to be spent. Explore the rest of the article to understand how APC influences economic growth and policy decisions.
Table of Comparison
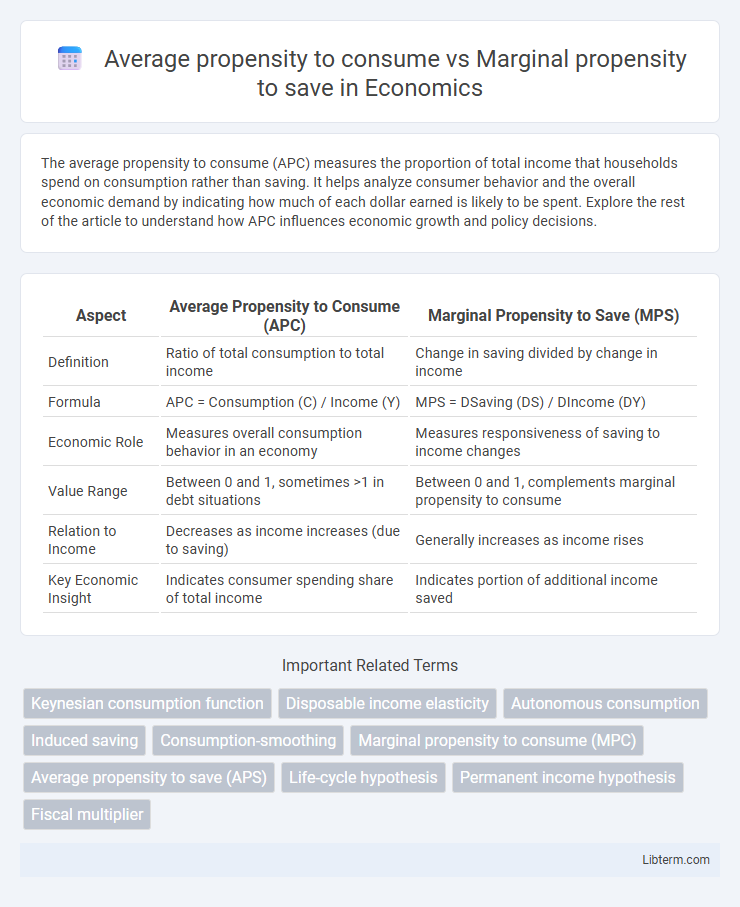
| Aspect | Average Propensity to Consume (APC) | Marginal Propensity to Save (MPS) |
|---|---|---|
| Definition | Ratio of total consumption to total income | Change in saving divided by change in income |
| Formula | APC = Consumption (C) / Income (Y) | MPS = DSaving (DS) / DIncome (DY) |
| Economic Role | Measures overall consumption behavior in an economy | Measures responsiveness of saving to income changes |
| Value Range | Between 0 and 1, sometimes >1 in debt situations | Between 0 and 1, complements marginal propensity to consume |
| Relation to Income | Decreases as income increases (due to saving) | Generally increases as income rises |
| Key Economic Insight | Indicates consumer spending share of total income | Indicates portion of additional income saved |
Introduction to Consumption and Saving Propensities
The average propensity to consume (APC) measures the proportion of total income spent on consumption, highlighting overall consumer behavior within an economy. The marginal propensity to save (MPS) represents the fraction of an additional unit of income that is saved rather than spent, emphasizing changes in saving habits with income fluctuations. Both APC and MPS are fundamental in understanding consumption and saving propensities, as they influence aggregate demand, investment, and economic growth dynamics.
Defining Average Propensity to Consume (APC)
Average Propensity to Consume (APC) measures the ratio of total consumption to total income, indicating the portion of income spent on goods and services. It provides insight into consumer behavior by showing how much of their income households allocate to consumption rather than saving. APC differs from Marginal Propensity to Save (MPS), which reflects the fraction of additional income that is saved rather than spent.
Defining Marginal Propensity to Save (MPS)
Marginal Propensity to Save (MPS) measures the fraction of additional income that a household saves rather than spends on consumption. It complements the Average Propensity to Consume (APC), which reflects the overall proportion of income spent on consumption across total income. In economic models, MPS is crucial for understanding savings behavior and predicting changes in aggregate demand based on income variations.
Mathematical Formulas and Calculations
Average Propensity to Consume (APC) is calculated using the formula APC = C / Y, where C represents total consumption and Y denotes total income, indicating the proportion of income spent on consumption. Marginal Propensity to Save (MPS) is expressed as MPS = DS / DY, where DS is the change in savings and DY is the change in income, measuring the fraction of additional income saved. These formulas are essential in macroeconomic models for analyzing consumption and saving behaviors, with the relationship APC + Average Propensity to Save (APS) equal to 1, and MPS + Marginal Propensity to Consume (MPC) also summing to 1.
Key Differences Between APC and MPS
The Average Propensity to Consume (APC) measures the ratio of total consumption to total income, indicating the overall percentage of income spent, while the Marginal Propensity to Save (MPS) represents the fraction of additional income that is saved rather than spent. APC provides insight into general spending behavior over a period, whereas MPS focuses on changes in saving behavior with incremental income increases. Unlike APC, which tends to decrease as income rises, MPS typically remains constant or increases, reflecting the tendency to save more from additional income.
Factors Influencing APC and MPS
The Average Propensity to Consume (APC) and Marginal Propensity to Save (MPS) are influenced by factors such as income levels, with higher incomes typically decreasing APC and increasing MPS due to greater saving capacity. Consumer confidence and economic stability also affect APC, where optimistic outlooks boost consumption while uncertainty encourages saving, impacting MPS. Government policies like taxation and interest rates further modulate APC and MPS by altering disposable income and incentives for saving or spending.
Economic Significance of APC and MPS
The Average Propensity to Consume (APC) measures the proportion of total income spent on consumption, reflecting overall consumer behavior and influencing aggregate demand and economic growth. The Marginal Propensity to Save (MPS) indicates the fraction of additional income saved rather than spent, affecting capital accumulation and investment potential in the economy. Understanding APC and MPS is crucial for policymakers to design effective fiscal policies that stimulate consumption or savings to stabilize or boost economic activity.
APC and MPS in Macroeconomic Models
Average propensity to consume (APC) measures the ratio of total consumption to total income, reflecting overall consumer spending behavior in macroeconomic models. Marginal propensity to save (MPS) indicates the fraction of an additional unit of income that is saved rather than spent, crucial for understanding savings and investment dynamics. Both APC and MPS influence the aggregate demand and equilibrium output, playing key roles in the Keynesian consumption function and multiplier effects.
Real-World Examples and Case Studies
The average propensity to consume (APC) measures the portion of total income that households spend on consumption, while the marginal propensity to save (MPS) indicates the fraction of additional income saved rather than spent. In real-world examples such as the 2008 financial crisis, US households exhibited a declining APC and increasing MPS, reflecting heightened uncertainty and a shift toward saving. Case studies from emerging economies like India show higher APC among lower-income groups with limited savings capacity, contrasting with higher-income households that display stronger MPS patterns due to greater disposable income and investment opportunities.
Policy Implications and Conclusion
The average propensity to consume (APC) reflects the overall share of income spent on consumption, influencing aggregate demand and fiscal stimulus effectiveness. Marginal propensity to save (MPS) indicates the proportion of additional income saved rather than spent, affecting the multiplier effect and long-term investment potential. Policy implications highlight the need for targeting income distribution and savings incentives to optimize economic growth and stabilize business cycles.
Average propensity to consume Infographic