Exponential distribution models the time between events in a Poisson process, where events occur continuously and independently at a constant average rate. It is widely used in reliability analysis, queuing theory, and survival studies to predict waiting times or lifespans. Discover how understanding exponential distribution can improve your data analysis by reading the rest of this article.
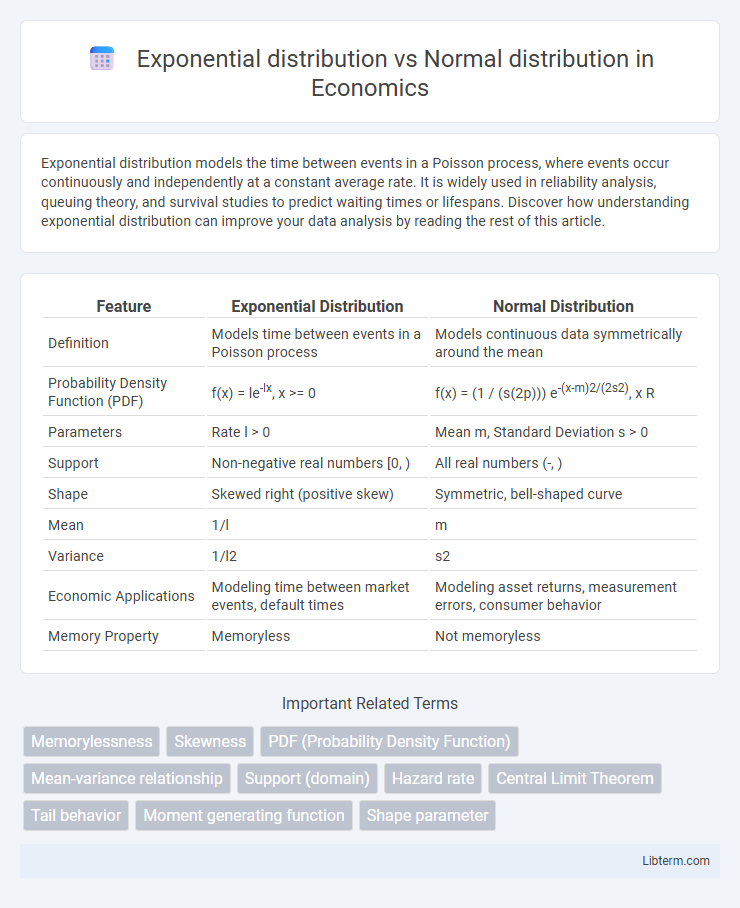
Table of Comparison
| Feature | Exponential Distribution | Normal Distribution |
|---|---|---|
| Definition | Models time between events in a Poisson process | Models continuous data symmetrically around the mean |
| Probability Density Function (PDF) | f(x) = le-lx, x >= 0 | f(x) = (1 / (s(2p))) e-(x-m)2/(2s2), x R |
| Parameters | Rate l > 0 | Mean m, Standard Deviation s > 0 |
| Support | Non-negative real numbers [0, ) | All real numbers (-, ) |
| Shape | Skewed right (positive skew) | Symmetric, bell-shaped curve |
| Mean | 1/l | m |
| Variance | 1/l2 | s2 |
| Economic Applications | Modeling time between market events, default times | Modeling asset returns, measurement errors, consumer behavior |
| Memory Property | Memoryless | Not memoryless |
Introduction to Exponential and Normal Distributions
The Exponential distribution models the time between events in a Poisson process, characterized by a constant hazard rate and a single parameter, the rate lambda (l). The Normal distribution, defined by its mean (m) and standard deviation (s), represents continuous data symmetrically distributed around the mean, commonly used in natural and social sciences. While the Exponential distribution is skewed and memoryless, the Normal distribution is symmetric and describes data clustering near the mean.
Definition of Exponential Distribution
The exponential distribution is a continuous probability distribution that models the time between events in a Poisson process, characterized by a constant rate parameter l (lambda). It has a probability density function defined as f(x) = le^(-lx) for x >= 0, representing the likelihood of time intervals between consecutive events. Unlike the normal distribution, which is symmetrical and defined by mean and variance, the exponential distribution is asymmetric and memoryless, emphasizing its use in reliability analysis and survival studies.
Definition of Normal Distribution
The Normal distribution, also known as the Gaussian distribution, is a continuous probability distribution characterized by its symmetric bell-shaped curve centered around the mean (m) and defined by its standard deviation (s). It models data with a natural variation where values are more likely to occur near the mean and less likely as they deviate further, exhibiting properties such as the empirical rule and central limit theorem. Unlike the Exponential distribution, which describes the time between events in a Poisson process and is skewed, the Normal distribution assumes data are symmetrically distributed around the mean.
Key Differences in Shape and Characteristics
The Exponential distribution is characterized by a single parameter, the rate (l), and exhibits a right-skewed, memoryless property with a continuous probability density function that decreases exponentially. In contrast, the Normal distribution is symmetric and bell-shaped, defined by two parameters: mean (m) and standard deviation (s), representing data with a central tendency and spread. While the Exponential distribution models time between independent events in a Poisson process, the Normal distribution describes naturally occurring variables with random variations around the mean.
Parameters: Mean and Variance Comparison
The Exponential distribution is characterized by a single parameter, the rate l, where the mean is 1/l and the variance is 1/l2, reflecting its memoryless property and skewed nature. In contrast, the Normal distribution is defined by two parameters: the mean m, which centers the distribution, and the variance s2, which measures the spread symmetrically around the mean. While the Normal distribution can take any real value with symmetric variance, the Exponential distribution is strictly positive with variance proportional to the square of the mean, highlighting their distinct applications in modeling time-to-event versus continuous symmetric data.
Probability Density Functions Explained
The Exponential distribution's probability density function (PDF) is defined as f(x; l) = le^(-lx) for x >= 0, characterizing the time between independent events in a Poisson process with rate parameter l. In contrast, the Normal distribution's PDF is f(x; m, s) = (1/(s2p)) e^(-(x-m)2/(2s2)), describing continuous data symmetrically distributed around the mean m with standard deviation s. These PDFs serve distinct modeling purposes: the Exponential captures memoryless event times, while the Normal models natural variations around a central tendency.
Real-World Applications of Each Distribution
Exponential distribution is widely used in modeling the time between events in Poisson processes, such as the lifespan of electronic components or the time between arrivals in queueing systems. Normal distribution plays a crucial role in natural and social sciences for representing measurement errors, heights, and IQ scores due to its symmetrical bell curve and central limit properties. Both distributions enable effective analysis in fields like reliability engineering and finance by fitting different types of data patterns.
When to Use: Exponential vs. Normal Distribution
Use the Exponential distribution for modeling the time between independent events in a Poisson process, such as the time until radioactive decay or customer arrivals. The Normal distribution is best suited for continuous data that clusters around a mean, such as heights, test scores, or measurement errors, where values exhibit symmetry and a bell-shaped curve. Selecting between Exponential and Normal distributions depends largely on whether the data represents waiting times for random events or naturally occurring variations with a central tendency.
Visualization: Graphical Comparison
The exponential distribution is characterized by a steeply declining curve starting at its maximum value at zero, reflecting the probability of time between events in a Poisson process, while the normal distribution displays a symmetric bell-shaped curve centered around its mean, representing data clustering around an average value. Visualization of the exponential distribution reveals a rapid decay, emphasizing its memoryless property, whereas the normal distribution's visualization highlights its symmetry and the spread determined by its standard deviation. Graphical comparison typically involves plotting probability density functions (PDFs) on the same axis to illustrate the distinct shapes and behaviors of these two fundamental distributions.
Summary and Key Takeaways
The exponential distribution models the time between events in a Poisson process, characterized by its memoryless property and a single parameter, the rate (lambda), while the normal distribution represents continuous data with a symmetric, bell-shaped curve defined by mean (mu) and standard deviation (sigma). Exponential distributions are skewed and used for modeling waiting times, whereas normal distributions are used for natural phenomena with data clustering around the mean. Understanding their distinct properties aids in selecting the appropriate distribution for statistical modeling and data analysis in fields like reliability engineering and finance.
Exponential distribution Infographic