Step response characterizes a system's output when subjected to a sudden change from zero to a fixed input, revealing its dynamic behavior and stability. Understanding step response is crucial for analyzing control systems and predicting performance under real-world conditions. Dive into the article to explore how step response impacts your system design and optimization.
Table of Comparison
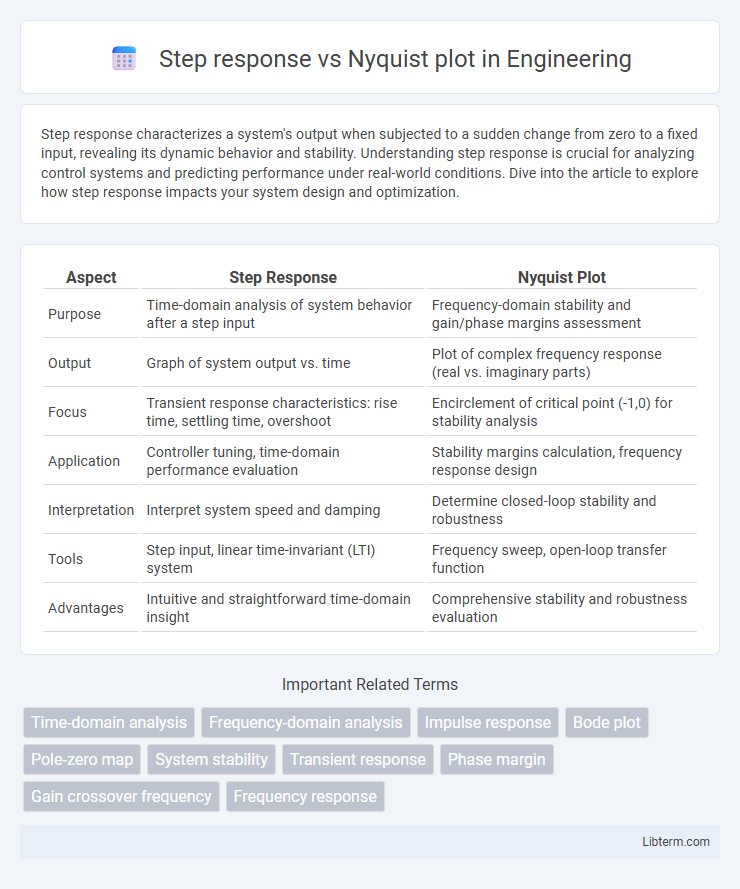
| Aspect | Step Response | Nyquist Plot |
|---|---|---|
| Purpose | Time-domain analysis of system behavior after a step input | Frequency-domain stability and gain/phase margins assessment |
| Output | Graph of system output vs. time | Plot of complex frequency response (real vs. imaginary parts) |
| Focus | Transient response characteristics: rise time, settling time, overshoot | Encirclement of critical point (-1,0) for stability analysis |
| Application | Controller tuning, time-domain performance evaluation | Stability margins calculation, frequency response design |
| Interpretation | Interpret system speed and damping | Determine closed-loop stability and robustness |
| Tools | Step input, linear time-invariant (LTI) system | Frequency sweep, open-loop transfer function |
| Advantages | Intuitive and straightforward time-domain insight | Comprehensive stability and robustness evaluation |
Introduction to Step Response and Nyquist Plot
Step response characterizes a system's time-domain reaction to a sudden input change, revealing stability, speed, and transient behavior. Nyquist plot provides a frequency-domain analysis by mapping the open-loop transfer function's complex values, assessing stability margins and gain/phase shifts. Together, these tools offer complementary insights essential for control system design and stability evaluation.
Fundamental Concepts in Control System Analysis
Step response reveals time-domain characteristics such as rise time, settling time, and steady-state error, directly illustrating system behavior to a sudden input. Nyquist plot represents the frequency-domain stability analysis by mapping the open-loop transfer function's complex values around the critical point (-1,0) in the complex plane. Together, these tools enable comprehensive control system analysis, linking transient performance and frequency stability margins essential for robust controller design.
Step Response: Definition and Purpose
Step response measures a system's time-domain behavior when subjected to a sudden input, revealing stability, speed, and transient characteristics essential for control system analysis. It provides insights into parameters such as rise time, settling time, overshoot, and steady-state error, critical for tuning controllers like PID. Unlike Nyquist plots, which analyze frequency response and stability margins in the frequency domain, step response focuses on the direct output evolution over time.
Nyquist Plot: Definition and Purpose
The Nyquist plot is a graphical representation used in control systems and signal processing to analyze the frequency response of a system by plotting the complex values of its transfer function as a function of frequency. It serves to assess system stability and robustness by displaying how the open-loop transfer function encircles the critical point (-1,0) in the complex plane, enabling the application of the Nyquist stability criterion. This visualization aids engineers in designing controllers and predicting potential oscillations or instability in feedback loops.
Key Differences between Step Response and Nyquist Plot
Step response provides time-domain information about a system's transient behavior and stability by showing how output evolves following a sudden input change, while Nyquist plot offers frequency-domain insight into system stability and phase margin by mapping the open-loop transfer function around the critical point. Step response highlights parameters like rise time, settling time, and overshoot, crucial for assessing time-based performance, whereas Nyquist plot focuses on gain and phase variations essential for frequency response and robustness analysis. Engineers use step response for time-domain tuning of controllers and Nyquist plots for frequency-domain stability criteria and gain margin evaluation.
Applications of Step Response Analysis
Step response analysis is essential in control systems for evaluating time-domain performance parameters such as rise time, settling time, overshoot, and steady-state error, which directly impact system stability and transient behavior. It helps in designing controllers by providing insight into system dynamics and predicting responses to sudden changes in input, making it crucial for tuning PID controllers and assessing system robustness. Unlike Nyquist plots, which analyze frequency-domain stability margins, step response analysis is primarily applied in time-domain performance optimization for mechanical, electrical, and process control systems.
Applications of Nyquist Plot in System Stability
Nyquist plots are essential in control system engineering for assessing system stability by providing a graphical representation of the frequency response and the open-loop transfer function's gain and phase margins. Engineers use Nyquist plots to determine the encirclement of the critical point (-1,0) in the complex plane, which directly indicates the stability or instability of feedback systems. This method is particularly valuable in designing robust controllers for electrical circuits, mechanical systems, and process control industries where precise stability analysis is critical.
Visual Interpretation: Time Domain vs Frequency Domain
Step response graphs depict a system's output over time, illustrating transient behaviors such as rise time, settling time, and overshoot, which provide intuitive insights into stability and damping in the time domain. Nyquist plots represent the system's frequency response by plotting the complex function of gain and phase across frequencies, facilitating the assessment of stability margins and robustness in the frequency domain. While step responses reveal temporal dynamics and time-based performance metrics, Nyquist plots enable comprehensive stability analysis through graphical interpretation of gain and phase margins at varying frequencies.
Advantages and Limitations of Both Methods
Step response analysis excels in providing time-domain insights such as rise time, settling time, and overshoot, making it ideal for evaluating transient behavior of control systems. Nyquist plot offers a frequency-domain perspective, effectively assessing system stability and robustness by visualizing gain and phase margins. While step response is limited in detecting frequency-specific instabilities, the Nyquist plot can be complex to interpret for non-experts and does not directly reveal time-domain performance characteristics.
Choosing the Right Analysis for System Evaluation
Step response analysis provides a clear time-domain perspective on system stability and transient behavior, making it ideal for evaluating rise time, settling time, and overshoot characteristics. Nyquist plot offers a frequency-domain approach to assess system stability margins, gain, and phase characteristics, crucial for understanding robustness against oscillations and external disturbances. Selecting the right analysis depends on whether temporal response or frequency stability insights are prioritized for effective control system design.
Step response Infographic