Goodman diagrams are essential tools in mechanical engineering for assessing the fatigue life of materials under varying stress conditions. By graphically representing the relationship between mean stress and alternating stress, the diagram helps predict failure and optimize design safety. Explore the rest of this article to understand how the Goodman diagram can enhance your material fatigue analysis.
Table of Comparison
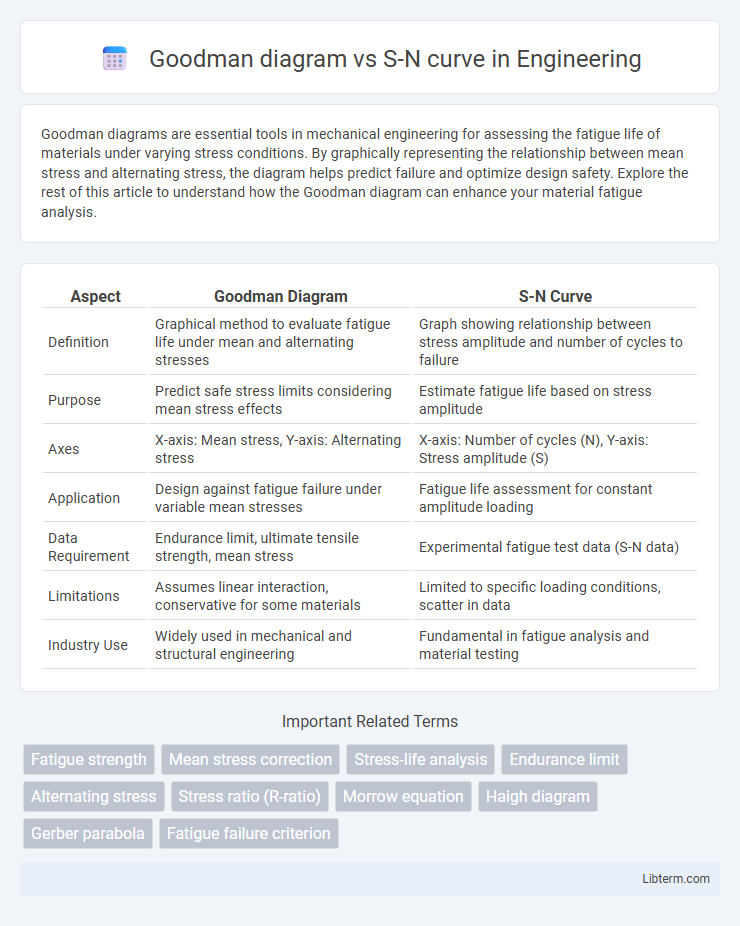
| Aspect | Goodman Diagram | S-N Curve |
|---|---|---|
| Definition | Graphical method to evaluate fatigue life under mean and alternating stresses | Graph showing relationship between stress amplitude and number of cycles to failure |
| Purpose | Predict safe stress limits considering mean stress effects | Estimate fatigue life based on stress amplitude |
| Axes | X-axis: Mean stress, Y-axis: Alternating stress | X-axis: Number of cycles (N), Y-axis: Stress amplitude (S) |
| Application | Design against fatigue failure under variable mean stresses | Fatigue life assessment for constant amplitude loading |
| Data Requirement | Endurance limit, ultimate tensile strength, mean stress | Experimental fatigue test data (S-N data) |
| Limitations | Assumes linear interaction, conservative for some materials | Limited to specific loading conditions, scatter in data |
| Industry Use | Widely used in mechanical and structural engineering | Fundamental in fatigue analysis and material testing |
Introduction to Fatigue Analysis
Goodman diagrams and S-N curves are fundamental tools in fatigue analysis, used to predict material lifespan under cyclic loading. The Goodman diagram incorporates mean and alternating stresses to evaluate safe stress limits, while S-N curves plot stress amplitude against the number of cycles to failure, highlighting material endurance. Both methods enable engineers to assess fatigue failure risk and optimize design for durability in mechanical components.
Overview of the Goodman Diagram
The Goodman diagram is a graphical representation used in fatigue analysis to evaluate the combined effects of mean stress and alternating stress on material durability. It plots alternating stress against mean stress, defining safe and failure regions based on material properties such as ultimate tensile strength and endurance limit. This approach extends the traditional S-N curve by accounting for mean stress influence, providing a more comprehensive assessment of fatigue life under variable loading conditions.
Understanding the S-N Curve
The S-N curve represents the relationship between cyclic stress (S) and the number of cycles to failure (N), crucial for predicting fatigue life in materials under variable loading. It typically features a decreasing curve where high stress levels lead to a low number of cycles before failure, while lower stress allows for more cycles, sometimes approaching a fatigue limit. Understanding the S-N curve enables engineers to estimate component durability and design against fatigue failure by selecting appropriate stress levels for expected service life.
Fundamental Differences Between Goodman Diagram and S-N Curve
The Goodman diagram graphically represents the relationship between mean stress and alternating stress to predict fatigue life under variable loading conditions, crucial for evaluating mean stress effects on fatigue strength. In contrast, the S-N curve plots stress amplitude against the number of cycles to failure, focusing solely on the fatigue life under constant amplitude loading without considering mean stress influence. The fundamental difference lies in the Goodman diagram's ability to incorporate mean stress effects for fatigue assessment, whereas the S-N curve provides fatigue data based on constant amplitude stress cycles only.
Application Scenarios: When to Use Goodman Diagram vs. S-N Curve
The Goodman diagram is primarily used in fatigue analysis to evaluate the combined effects of mean stress and alternating stress on material life, making it ideal for designing components under fluctuating loads with significant mean stresses. The S-N curve focuses on the relationship between stress amplitude and number of cycles to failure, suitable for high-cycle fatigue assessment where mean stress effects are negligible. Use the Goodman diagram when assessing variable mean stresses in mechanical components, and rely on the S-N curve for estimating fatigue life under purely cyclic loading conditions.
Material Limitations and Assumptions
The Goodman diagram integrates mean stress effects and material fatigue limits, assuming linear damage accumulation and isotropic material behavior, which may not capture complex loading scenarios or anisotropic properties. The S-N curve represents the relationship between stress amplitude and fatigue life for a specific material under cyclic loading but assumes constant amplitude loading and does not inherently account for mean stress or multiaxial stress states. Material limitations in the Goodman diagram arise from its reliance on tensile strength and endurance limit, whereas S-N curves depend heavily on empirical fatigue test data specific to material composition and surface finish.
Graphical Interpretation: Reading Goodman and S-N Plots
Goodman diagrams graphically represent the relationship between mean stress and alternating stress to predict fatigue failure, showing safe and failure regions based on material endurance limits. S-N curves plot stress amplitude against the number of cycles to failure, providing empirical data on fatigue life under varying cyclic loads. Reading a Goodman diagram involves identifying the intersection of operating stress points within the safe envelope, while interpreting S-N plots requires correlating stress levels to expected fatigue life cycles for design decisions.
Factors Influencing Results: Mean Stress and Stress Amplitude
Goodman diagrams and S-N curves both analyze fatigue life but differ in accounting for mean stress and stress amplitude effects. Goodman diagrams incorporate mean stress directly, providing a graphical method to assess combined mean and alternating stresses on fatigue failure, while S-N curves primarily plot stress amplitude versus cycles to failure under zero-mean stress conditions. Mean stress shifts fatigue limits in Goodman diagrams, whereas stress amplitude dominates the fatigue behavior described by S-N curves.
Advantages and Limitations of Each Method
The Goodman diagram offers a clear visualization of the interaction between mean stress and alternating stress, making it effective for evaluating fatigue life under variable loading conditions, but it tends to be conservative for materials with complex stress states. The S-N curve directly relates cyclic stress amplitude to fatigue life, providing detailed empirical data for specific materials, yet it often lacks accuracy when mean stresses deviate from zero or when multiaxial stresses are present. Combining both methods can enhance fatigue analysis by leveraging the Goodman diagram's mean stress considerations and the S-N curve's experimental foundation, though care must be taken due to their respective simplifications and assumptions.
Conclusion: Selecting the Right Approach for Fatigue Assessment
Goodman diagrams provide a graphical method to evaluate fatigue failure by combining mean and alternating stresses, making them suitable for components subjected to varying stress states. S-N curves offer a detailed fatigue life prediction based on experimental data for specific materials under cyclic loading. Selecting the right approach depends on the complexity of the loading conditions and available material data, with Goodman diagrams favoring quick assessments and S-N curves supporting precise fatigue life estimations.
Goodman diagram Infographic