The quadratic production function models output as a function of input where the relationship includes squared terms, capturing diminishing or increasing returns to scale. This function is particularly useful in analyzing how changes in input levels affect productivity in agriculture, manufacturing, and economics. Explore the article to understand how this model applies to optimizing Your production processes.
Table of Comparison
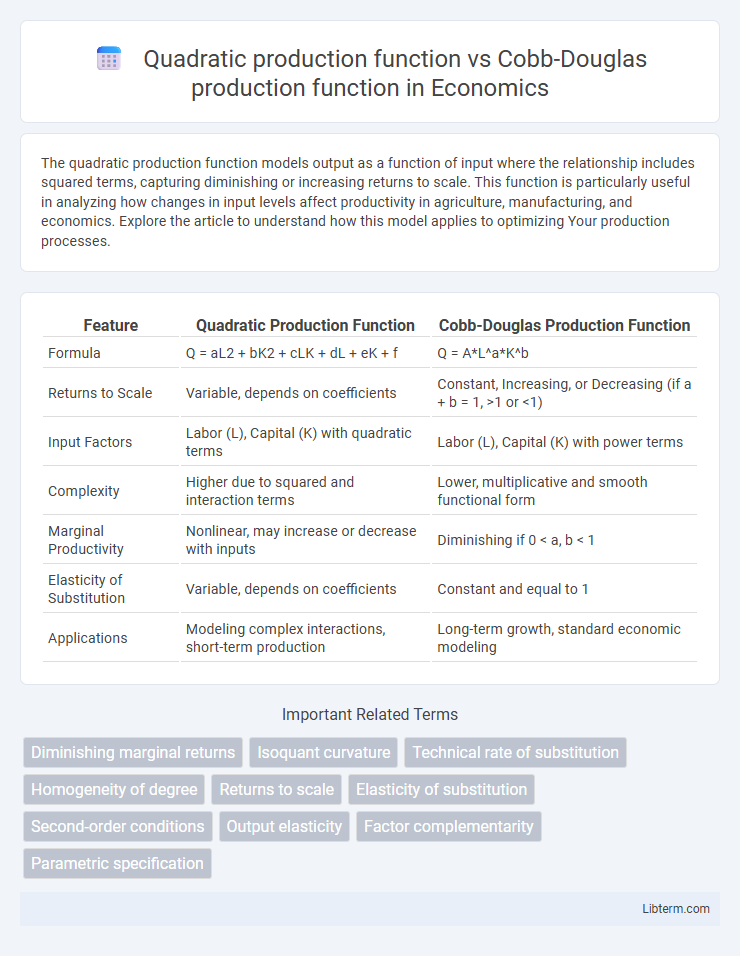
| Feature | Quadratic Production Function | Cobb-Douglas Production Function |
|---|---|---|
| Formula | Q = aL2 + bK2 + cLK + dL + eK + f | Q = A*L^a*K^b |
| Returns to Scale | Variable, depends on coefficients | Constant, Increasing, or Decreasing (if a + b = 1, >1 or <1) |
| Input Factors | Labor (L), Capital (K) with quadratic terms | Labor (L), Capital (K) with power terms |
| Complexity | Higher due to squared and interaction terms | Lower, multiplicative and smooth functional form |
| Marginal Productivity | Nonlinear, may increase or decrease with inputs | Diminishing if 0 < a, b < 1 |
| Elasticity of Substitution | Variable, depends on coefficients | Constant and equal to 1 |
| Applications | Modeling complex interactions, short-term production | Long-term growth, standard economic modeling |
Introduction to Production Functions
Production functions model the relationship between input factors and output in economics, capturing how resources like labor and capital generate goods or services. The quadratic production function allows for nonlinear interactions and varying marginal returns through polynomial terms, offering flexibility in representing complex production processes. In contrast, the Cobb-Douglas production function employs a multiplicative form with constant elasticities of output with respect to inputs, providing a simpler, widely used model with constant returns to scale assumptions.
Understanding the Quadratic Production Function
The quadratic production function incorporates squared input terms, allowing it to capture nonlinear relationships between inputs and output, making it suitable for modeling diminishing or increasing returns to scale more flexibly than the Cobb-Douglas production function. Unlike the Cobb-Douglas form, which assumes constant elasticity of substitution and multiplicative inputs, the quadratic form can represent more complex input interactions through its polynomial terms. This flexibility enables economists to better analyze production processes where input effects vary at different levels, providing a nuanced understanding of technology and efficiency in production.
Overview of the Cobb-Douglas Production Function
The Cobb-Douglas production function is a widely used economic model that represents the relationship between two or more inputs, typically labor and capital, and the resulting output using a multiplicative form with constant elasticities. It takes the general form Q = A * L^a * K^b, where Q is total production, L is labor input, K is capital input, A is total factor productivity, and a and b are the output elasticities of labor and capital, respectively. This function assumes constant returns to scale if a + b = 1 and provides analytical convenience and empirical flexibility compared to the quadratic production function, which incorporates squared input terms for capturing more complex input-output relationships.
Mathematical Forms and Key Differences
The quadratic production function is expressed as Q = aL2 + bK2 + cLK + dL + eK + f, capturing complex interactions and non-linear effects of labor (L) and capital (K) on output (Q). The Cobb-Douglas production function takes the form Q = AL^aK^b, emphasizing constant returns to scale and multiplicative input relationships where A represents total factor productivity, and a, b are output elasticities. Key differences include the quadratic function's allowance for diminishing or increasing marginal returns through squared terms and cross-effects, while the Cobb-Douglas function assumes smooth substitutability between inputs with fixed elasticities and typically exhibits constant or decreasing returns to scale.
Assumptions Underlying Each Model
The quadratic production function assumes nonlinear relationships with potential diminishing or increasing returns to scale, allowing for more flexibility in capturing complex input-output dynamics. The Cobb-Douglas production function is based on assumptions of constant returns to scale, smooth substitutability between inputs, and multiplicative separability, with fixed output elasticities reflecting input contributions. Each model's assumptions directly influence their suitability for different types of production analysis and empirical estimation.
Returns to Scale: Quadratic vs Cobb-Douglas
Returns to scale in the Quadratic production function exhibit greater flexibility as output can increase at varying rates depending on the interaction between input levels, unlike the Cobb-Douglas production function which demonstrates constant returns to scale when the sum of input exponents equals one. The Quadratic function allows for increasing, constant, or decreasing returns to scale due to its nonlinear terms, capturing complexities in input-output relationships that Cobb-Douglas cannot. Empirical applications often show Quadratic functions better model real-world scenarios with variable returns, while Cobb-Douglas serves as a simpler, more restrictive benchmark.
Practical Applications in Economics
Quadratic production functions allow precise modeling of output responses to varying input levels, ideal for capturing nonlinear returns to scale in agricultural and manufacturing sectors. Cobb-Douglas production functions, with their constant elasticities of substitution, are extensively used in macroeconomic growth models and firm-level productivity analysis due to their simplicity and empirical tractability. Both functions facilitate optimal resource allocation and cost minimization strategies but differ in flexibility and complexity, influencing their application in economic forecasting and input-output analysis.
Advantages and Limitations of the Quadratic Model
The Quadratic production function offers greater flexibility in modeling non-linear relationships between inputs and outputs, capturing diminishing or increasing marginal returns more accurately than the Cobb-Douglas function. Its ability to represent complex input interactions provides nuanced insights into production processes, especially in industries with variable factor productivity. However, the Quadratic model's complexity can lead to overfitting, requires more parameters for estimation, and may suffer from interpretability challenges compared to the simpler, more intuitive Cobb-Douglas function.
Strengths and Weaknesses of the Cobb-Douglas Model
The Cobb-Douglas production function is favored for its simplicity and ability to represent output elasticity with respect to labor and capital, making it highly effective for empirical analysis and economic modeling. Its constant returns to scale assumption enables straightforward interpretation but limits flexibility in capturing increasing or decreasing returns in more complex production processes. However, the model's limitation lies in its restrictive functional form, potentially oversimplifying real-world production technology by not accounting for factor substitutability variations that quadratic production functions can better address.
Choosing the Right Production Function for Analysis
Choosing the right production function for analysis depends on the specific characteristics of the production process and the type of returns to scale being studied. The Cobb-Douglas production function is widely used for its simplicity, constant elasticities of substitution, and ability to model multiplicative input interactions, making it ideal for economies exhibiting constant or variable returns to scale. In contrast, the Quadratic production function captures more complex input relationships and non-linearities, providing greater flexibility in representing increasing or decreasing marginal returns, but it requires more data and computational resources for accurate estimation.
Quadratic production function Infographic