A utility function measures preferences by assigning numerical values to different options, helping to quantify satisfaction or happiness from choices. It plays a crucial role in economics and decision theory by guiding optimal decision-making based on individual or collective priorities. Explore the rest of the article to deepen your understanding of how utility functions shape economic behavior and strategic choices.
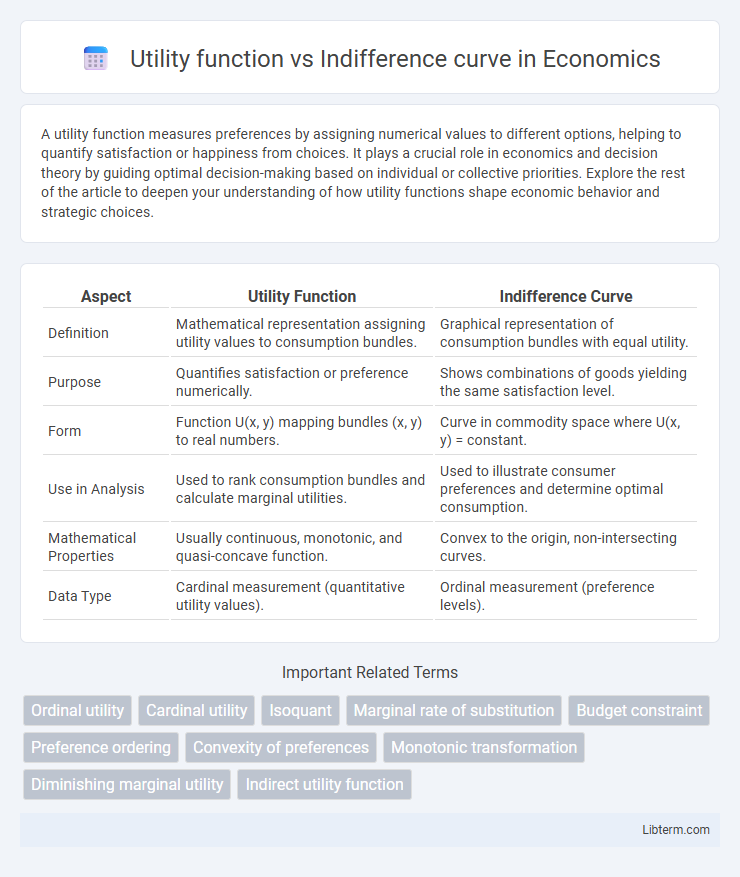
Table of Comparison
| Aspect | Utility Function | Indifference Curve |
|---|---|---|
| Definition | Mathematical representation assigning utility values to consumption bundles. | Graphical representation of consumption bundles with equal utility. |
| Purpose | Quantifies satisfaction or preference numerically. | Shows combinations of goods yielding the same satisfaction level. |
| Form | Function U(x, y) mapping bundles (x, y) to real numbers. | Curve in commodity space where U(x, y) = constant. |
| Use in Analysis | Used to rank consumption bundles and calculate marginal utilities. | Used to illustrate consumer preferences and determine optimal consumption. |
| Mathematical Properties | Usually continuous, monotonic, and quasi-concave function. | Convex to the origin, non-intersecting curves. |
| Data Type | Cardinal measurement (quantitative utility values). | Ordinal measurement (preference levels). |
Introduction to Utility Function and Indifference Curve
Utility function represents a mathematical model that quantifies consumer preferences by assigning numerical values to different bundles of goods, reflecting the level of satisfaction or happiness derived. Indifference curves graphically illustrate combinations of two goods that yield equal utility, helping to analyze consumer choices without specifying exact utility values. Both tools are fundamental in microeconomics for understanding demand behavior and preference ranking.
Defining Utility Function in Economics
A utility function in economics quantifies consumer preferences by assigning numerical values to different bundles of goods, enabling the measurement of satisfaction or happiness derived from consumption. Unlike indifference curves, which graphically represent combinations of goods that yield equal utility, utility functions provide a precise mathematical formulation of those preferences. This mathematical approach facilitates optimization problems such as maximizing utility subject to budget constraints and deepens analysis in consumer theory.
Understanding Indifference Curves
Indifference curves represent combinations of goods that provide a consumer with equal satisfaction or utility, illustrating preferences without assigning specific utility values. Unlike utility functions that quantify satisfaction numerically, indifference curves graphically depict the trade-offs a consumer is willing to make between different goods while maintaining the same level of overall utility. Understanding indifference curves is crucial for analyzing consumer choice behavior, as they reveal the rate at which a consumer is willing to substitute one good for another without changing their overall happiness.
The Mathematical Foundations of Utility Functions
Utility functions mathematically represent consumer preferences by assigning numerical values to different consumption bundles, enabling the quantification of satisfaction or utility. Indifference curves, defined by the set of points where the utility function remains constant, illustrate combinations of goods that yield equal satisfaction to the consumer. The mathematical foundation relies on properties such as continuity, monotonicity, and convexity, ensuring the utility function is well-behaved and indifference curves are smooth, downward sloping, and convex to the origin.
Graphical Representation of Indifference Curves
Indifference curves graphically represent consumer preferences by showing combinations of goods that provide equal satisfaction, typically depicted as smooth, downward-sloping convex curves in a two-dimensional space. Utility functions assign numerical values to these preferences, with each indifference curve corresponding to a specific utility level, illustrating the same utility for different bundles. The shape and spacing of indifference curves reflect marginal rates of substitution, capturing the trade-offs a consumer is willing to make between goods.
Key Differences: Utility Function vs Indifference Curve
Utility functions assign numerical values to different bundles of goods, quantifying consumer satisfaction or preferences, while indifference curves graphically represent combinations of goods that yield the same level of utility. Utility functions provide a cardinal measure of satisfaction, enabling comparison of utility differences, whereas indifference curves offer an ordinal ranking without specifying the magnitude of preference. Key differences lie in their representation format, measurement capability, and use in consumer choice analysis; utility functions allow for direct utility maximization, and indifference curves illustrate preference patterns and trade-offs between goods.
Practical Applications in Consumer Theory
Utility functions quantify consumer preferences by assigning numerical values to different bundles of goods, enabling precise modeling of choice behavior under budget constraints. Indifference curves graphically represent combinations of goods that yield equal satisfaction, facilitating the analysis of trade-offs and marginal rates of substitution in consumer optimization problems. Practical applications in consumer theory include demand estimation, welfare analysis, and predicting changes in consumption patterns due to price or income variations.
Limitations of Utility Functions and Indifference Curves
Utility functions often assume cardinal measurability and consistent preference ranking, which can oversimplify complex human behavior and ignore psychological factors influencing decision-making. Indifference curves rely on the assumption of convex preferences and continuous substitutability, limiting their applicability in real-world scenarios with discrete choices or non-convex preferences. Both models struggle to capture dynamic preferences, context-dependent choices, and the impact of uncertainty on consumer decisions.
Role in Analyzing Consumer Preferences
Utility functions quantify consumer preferences by assigning numerical values to different bundles of goods, enabling direct comparison and optimization of choices. Indifference curves graphically represent combinations of goods that provide the same level of satisfaction, illustrating consumer trade-offs without requiring numerical utility values. Together, these tools facilitate a comprehensive analysis of consumer behavior by linking measurable utility with visual preference mapping.
Conclusion: Choosing the Right Analytical Tool
Utility functions provide a precise numerical representation of consumer preferences, enabling quantitative analysis and optimization in economic modeling. Indifference curves visually depict combinations of goods yielding equal satisfaction, facilitating intuitive understanding of trade-offs without requiring exact utility values. Selecting between these tools depends on the analytical goal: utility functions are ideal for rigorous optimization and welfare analysis, whereas indifference curves excel in illustrating consumer choice behavior and preference structure.
Utility function Infographic