Uniform distribution describes a probability distribution where all outcomes are equally likely within a defined range, making it fundamental in statistics and probability theory. This distribution is often applied in simulations, random sampling, and modeling scenarios requiring unbiased data generation. Explore the rest of the article to understand how uniform distribution impacts various fields and practical applications for your analytical projects.
Table of Comparison
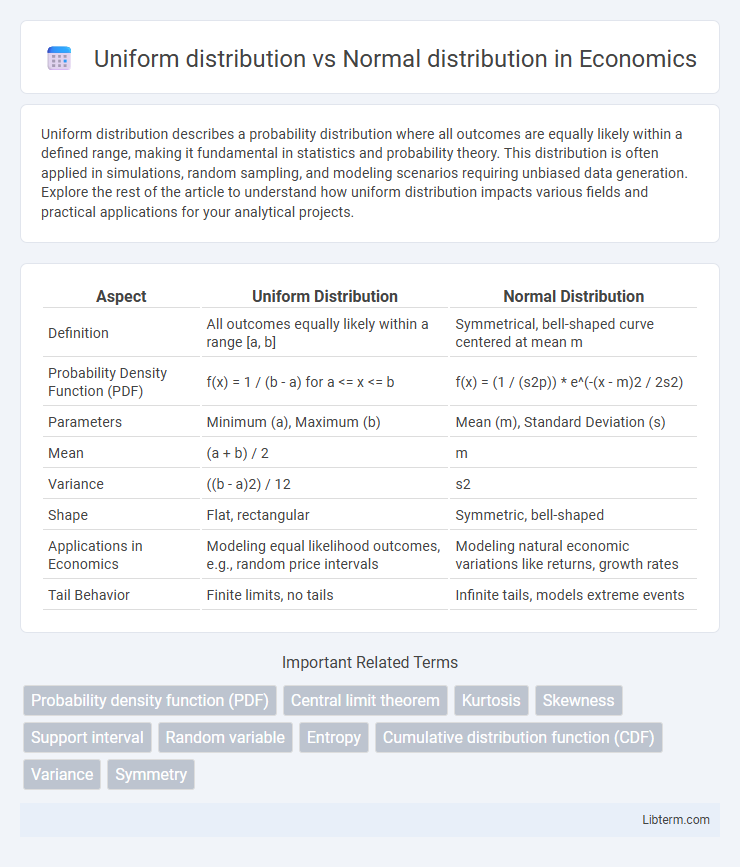
| Aspect | Uniform Distribution | Normal Distribution |
|---|---|---|
| Definition | All outcomes equally likely within a range [a, b] | Symmetrical, bell-shaped curve centered at mean m |
| Probability Density Function (PDF) | f(x) = 1 / (b - a) for a <= x <= b | f(x) = (1 / (s2p)) * e^(-(x - m)2 / 2s2) |
| Parameters | Minimum (a), Maximum (b) | Mean (m), Standard Deviation (s) |
| Mean | (a + b) / 2 | m |
| Variance | ((b - a)2) / 12 | s2 |
| Shape | Flat, rectangular | Symmetric, bell-shaped |
| Applications in Economics | Modeling equal likelihood outcomes, e.g., random price intervals | Modeling natural economic variations like returns, growth rates |
| Tail Behavior | Finite limits, no tails | Infinite tails, models extreme events |
Introduction to Probability Distributions
Uniform distribution assigns equal probability to all outcomes within a specific range, making it ideal for modeling scenarios with equally likely events such as rolling a fair die. Normal distribution, characterized by its bell-shaped curve and parameters mean (m) and standard deviation (s), describes data clustering around a central value with symmetrical tails, commonly used in natural and social sciences. Understanding these fundamental probability distributions enables accurate representation and analysis of diverse real-world phenomena in statistics and machine learning.
What is Uniform Distribution?
Uniform distribution is a probability distribution where all outcomes are equally likely within a defined range, characterized by constant probability density. This distribution is commonly used in simulations and random sampling when each event must have the same chance of occurring. Unlike normal distribution, uniform distribution has no peaks or tails, and its variance depends solely on the interval length.
What is Normal Distribution?
Normal distribution, also known as Gaussian distribution, is a continuous probability distribution characterized by its symmetric bell-shaped curve centered around the mean, where data points are most concentrated. It is defined by two parameters: the mean (m) which indicates the distribution's center, and the standard deviation (s) which measures the spread or variability of the data. Unlike uniform distribution, where all outcomes are equally likely within an interval, the normal distribution models natural phenomena where values cluster around the mean with decreasing frequency towards the tails.
Key Differences Between Uniform and Normal Distributions
Uniform distribution features constant probability density across its entire range, meaning all outcomes within the interval are equally likely, whereas normal distribution has a bell-shaped curve with values concentrated around the mean. The uniform distribution is defined by two parameters, minimum and maximum bounds, while the normal distribution is characterized by its mean and standard deviation. Uniform distribution lacks skewness and kurtosis, contrasting with the normal distribution, which exhibits zero skewness and kurtosis of three in its standard form.
Mathematical Formulas and Properties
The uniform distribution is defined by the probability density function (PDF) \( f(x) = \frac{1}{b-a} \) for \( a \leq x \leq b \), with mean \( \mu = \frac{a+b}{2} \) and variance \( \sigma^2 = \frac{(b-a)^2}{12} \). The normal distribution's PDF is given by \( f(x) = \frac{1}{\sigma\sqrt{2\pi}} e^{-\frac{(x-\mu)^2}{2\sigma^2}} \), characterized by parameters mean \( \mu \) and variance \( \sigma^2 \), representing its symmetric bell-shaped curve. While the uniform distribution has constant probability over its interval, the normal distribution exhibits a continuous, infinitely supported shape with probabilities concentrated around its mean.
Visual Representation: Uniform vs Normal
Uniform distribution displays a constant probability across its entire range, resulting in a rectangular shape where all intervals have equal height. Normal distribution features a bell-shaped curve characterized by its symmetric peak at the mean, tapering off smoothly toward the tails, reflecting the highest likelihood near the center. Visualizing these distributions highlights the uniform distribution's lack of variance in frequency versus the normal distribution's concentration of values around the mean and lower probability in the extremities.
Real-World Applications of Uniform Distribution
Uniform distribution models scenarios where all outcomes have equal probability, making it ideal for simulating random sampling in computer algorithms and cryptographic key generation. It is commonly used in quality control processes to represent tolerances with equally likely variations and in gaming to ensure fair chance outcomes. Unlike the normal distribution, which models natural variations around a mean, uniform distribution applies best to systems with equally probable discrete or continuous events.
Real-World Applications of Normal Distribution
The normal distribution plays a crucial role in real-world applications such as finance for modeling stock returns, health sciences for analyzing measurement errors and biological data, and quality control in manufacturing through control charts that monitor process variability. Unlike the uniform distribution, which assumes equal probability across a range, the normal distribution accurately captures natural variability and the tendency of data to cluster around a mean, making it ideal for predictive analytics and risk assessment. Implementations in machine learning algorithms and statistical inference heavily rely on the properties of normal distribution to draw meaningful conclusions from data.
Choosing the Right Distribution for Your Data
Uniform distribution assumes all outcomes within a specified range are equally likely, making it ideal for modeling scenarios with limited variability and no central tendency. Normal distribution, characterized by its bell curve, is suitable for data that clusters around a mean, often arising from natural processes or measurement errors. Selecting the appropriate distribution depends on understanding your data's spread and underlying processes--use uniform when data is evenly spread, and normal when data exhibits symmetry and concentration around an average value.
Conclusion: Uniform vs Normal—When and Why
Uniform distribution is ideal for modeling scenarios with equally likely outcomes and limited variability, making it suitable for simulations, random sampling, and simple probability models. Normal distribution is preferred when data exhibits natural variability, central tendency, and follows the empirical rule, commonly applied in statistics, natural sciences, and finance. Choosing between uniform and normal distributions depends on the underlying data characteristics and the purpose of analysis, where uniform reflects fixed bounds and equal probabilities, while normal models continuous, symmetric data with a mean and standard deviation.
Uniform distribution Infographic