The Kuznets curve illustrates the relationship between economic development and income inequality, suggesting that inequality rises during early industrial growth and falls as a country becomes more affluent. This concept highlights how structural changes in the economy influence wealth distribution and social equity over time. Discover how the Kuznets curve applies to modern economic policies and what it means for Your country's future.
Table of Comparison
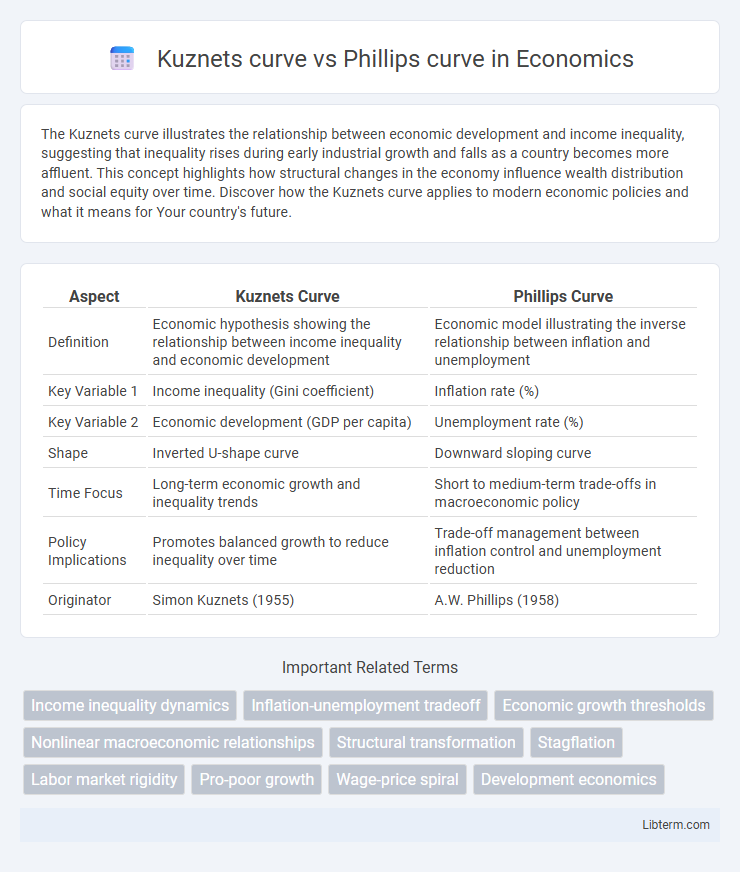
| Aspect | Kuznets Curve | Phillips Curve |
|---|---|---|
| Definition | Economic hypothesis showing the relationship between income inequality and economic development | Economic model illustrating the inverse relationship between inflation and unemployment |
| Key Variable 1 | Income inequality (Gini coefficient) | Inflation rate (%) |
| Key Variable 2 | Economic development (GDP per capita) | Unemployment rate (%) |
| Shape | Inverted U-shape curve | Downward sloping curve |
| Time Focus | Long-term economic growth and inequality trends | Short to medium-term trade-offs in macroeconomic policy |
| Policy Implications | Promotes balanced growth to reduce inequality over time | Trade-off management between inflation control and unemployment reduction |
| Originator | Simon Kuznets (1955) | A.W. Phillips (1958) |
Introduction to Economic Curves
Economic curves like the Kuznets curve and Phillips curve illustrate key relationships in macroeconomics, helping to analyze economic growth and inflation dynamics. The Kuznets curve depicts an inverted U-shape relationship between income inequality and economic development, suggesting inequality rises then falls as economies grow. The Phillips curve demonstrates an inverse correlation between unemployment and inflation, indicating lower unemployment rates often coincide with higher inflation pressures.
Defining the Kuznets Curve
The Kuznets Curve illustrates an empirical relationship between economic development and income inequality, suggesting that inequality first rises and then falls as a country industrializes. This inverted U-shaped curve was proposed by economist Simon Kuznets based on historical data from developed countries. Unlike the Phillips Curve, which depicts the trade-off between inflation and unemployment, the Kuznets Curve specifically addresses the dynamic patterns of income distribution during economic growth.
Understanding the Phillips Curve
The Phillips Curve illustrates the inverse relationship between unemployment and inflation, suggesting that lower unemployment rates often lead to higher inflation due to increased wage demands. This economic model helps policymakers balance inflation control with job growth by analyzing labor market dynamics. Understanding the Phillips Curve is crucial for designing monetary policies that aim to stabilize both inflation and employment levels effectively.
Historical Background of Both Curves
The Kuznets curve, developed by economist Simon Kuznets in the 1950s, illustrates the relationship between economic development and income inequality, proposing an inverted U-shape where inequality first rises then falls with economic growth. The Phillips curve, introduced by A.W. Phillips in 1958, represents the empirical inverse relationship between unemployment and inflation in the short run. Both curves emerged from post-World War II economic research, reflecting efforts to understand dynamic macroeconomic and social trends during periods of rapid industrialization and economic change.
Key Variables Compared
The Kuznets curve primarily examines the relationship between economic development and income inequality, using variables such as GDP per capita and income distribution metrics like the Gini coefficient. The Phillips curve analyzes the inverse relationship between inflation rates and unemployment levels, focusing on variables like wage inflation and labor market slack. Both models explore key macroeconomic trade-offs but differ fundamentally in their focus on income disparity versus employment-inflation dynamics.
Theoretical Foundations: Inequality vs. Inflation
The Kuznets curve theorizes an inverted U-shaped relationship between economic development and income inequality, suggesting that inequality initially rises during early industrialization before declining in advanced stages. The Phillips curve models an inverse correlation between unemployment and inflation, implying that lower unemployment rates tend to increase inflationary pressure. These frameworks differ fundamentally, with the Kuznets curve emphasizing structural changes affecting income distribution, while the Phillips curve centers on macroeconomic policy trade-offs impacting price stability and labor markets.
Empirical Evidence and Applications
Empirical evidence for the Kuznets curve shows mixed results, with some studies confirming the inverted U-shape relationship between income inequality and economic development, while others find varying patterns depending on regional and temporal contexts. Phillips curve data often reveal a short-run trade-off between inflation and unemployment, but long-term evidence suggests this relationship may weaken due to adaptive expectations and inflation targeting policies. Applications of the Kuznets curve inform income distribution and social policy strategies, whereas Phillips curve insights are crucial for central banks managing monetary policy and inflation control.
Policy Implications of the Curves
The Kuznets curve suggests that economic inequality initially rises then decreases as a country develops, guiding policymakers to prioritize inclusive growth strategies and social safety nets to mitigate early-stage disparities. The Phillips curve highlights the inverse relationship between inflation and unemployment, informing central banks to balance monetary policies that control inflation without causing excessive job losses. Understanding both curves helps policymakers design balanced approaches that promote stable economic growth while addressing social equity and labor market dynamics.
Criticisms and Limitations
The Kuznets curve faces criticism for its oversimplification of income inequality trends, failing to account for multiple influencing factors like policy changes and globalization, which can disrupt the predicted inverted-U shape. The Phillips curve is limited by its assumption of a stable trade-off between inflation and unemployment, a relationship that has weakened during periods of stagflation and in modern economies with adaptive expectations. Both curves are challenged by empirical inconsistencies, highlighting the need for more nuanced models that incorporate dynamic socio-economic variables and structural shifts.
Conclusion: Comparing Impact on Economic Policy
The Kuznets curve highlights the trade-off between economic growth and income inequality, influencing policies aimed at balanced development and social equity. The Phillips curve emphasizes the short-term inverse relationship between inflation and unemployment, guiding monetary policy decisions on inflation targeting and labor market interventions. Policymakers must integrate insights from both curves to address complex economic challenges involving growth, inflation, and employment simultaneously.
Kuznets curve Infographic