The characteristic line represents the relationship between an asset's expected return and the overall market return, illustrating how sensitive the asset is to market movements. It is a fundamental concept in finance, used to assess systematic risk and calculate beta, which helps investors predict potential asset performance. Explore the rest of the article to understand how the characteristic line can influence your investment decisions.
Table of Comparison
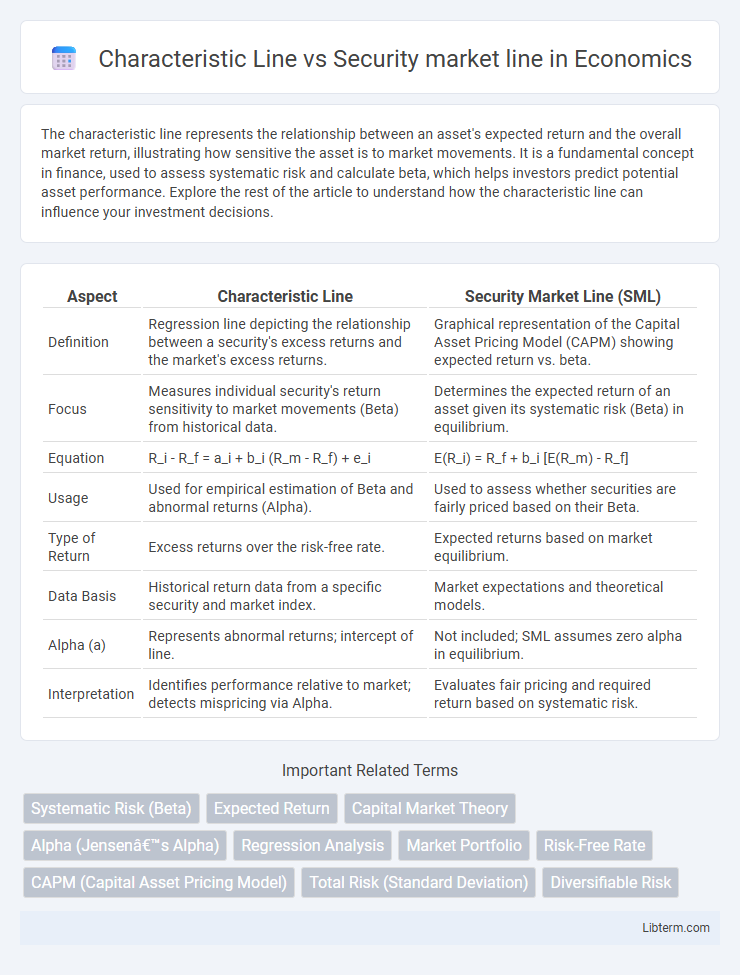
| Aspect | Characteristic Line | Security Market Line (SML) |
|---|---|---|
| Definition | Regression line depicting the relationship between a security's excess returns and the market's excess returns. | Graphical representation of the Capital Asset Pricing Model (CAPM) showing expected return vs. beta. |
| Focus | Measures individual security's return sensitivity to market movements (Beta) from historical data. | Determines the expected return of an asset given its systematic risk (Beta) in equilibrium. |
| Equation | R_i - R_f = a_i + b_i (R_m - R_f) + e_i | E(R_i) = R_f + b_i [E(R_m) - R_f] |
| Usage | Used for empirical estimation of Beta and abnormal returns (Alpha). | Used to assess whether securities are fairly priced based on their Beta. |
| Type of Return | Excess returns over the risk-free rate. | Expected returns based on market equilibrium. |
| Data Basis | Historical return data from a specific security and market index. | Market expectations and theoretical models. |
| Alpha (a) | Represents abnormal returns; intercept of line. | Not included; SML assumes zero alpha in equilibrium. |
| Interpretation | Identifies performance relative to market; detects mispricing via Alpha. | Evaluates fair pricing and required return based on systematic risk. |
Introduction to Characteristic Line and Security Market Line
The Characteristic Line represents the relationship between a single security's excess returns and the market's excess returns, providing a regression-based measure of systematic risk known as beta. The Security Market Line (SML) illustrates the expected return of assets as a function of their beta, serving as a graphical representation of the Capital Asset Pricing Model (CAPM). While the Characteristic Line focuses on historical performance and beta estimation, the SML emphasizes expected returns and risk premiums across the market.
Defining the Characteristic Line
The Characteristic Line represents the regression line that plots an individual security's excess returns against the excess returns of the market, highlighting the relationship between the security's performance and market movements. It quantifies the security's beta, which measures its systematic risk relative to the market portfolio. Unlike the Security Market Line that depicts expected returns based on beta, the Characteristic Line directly analyzes historical return behavior for risk assessment.
Understanding the Security Market Line (SML)
The Security Market Line (SML) represents the expected return of an asset as a function of its systematic risk, measured by beta, illustrating the trade-off between risk and return in the Capital Asset Pricing Model (CAPM). Unlike the Characteristic Line, which plots an asset's excess returns against the market's excess returns to estimate beta, the SML provides a benchmark for evaluating whether a security offers a fair expected return given its risk level. Understanding the SML is crucial for investors as it helps assess if an asset is underpriced or overpriced relative to its market risk, guiding optimal portfolio decisions.
Role in Capital Asset Pricing Model (CAPM)
The Characteristic Line represents the regression of an individual asset's returns against the market portfolio returns, showing the asset's beta, which measures systematic risk in the Capital Asset Pricing Model (CAPM). The Security Market Line (SML) graphs expected returns of assets as a function of beta, illustrating the risk-return tradeoff and serving as a benchmark for evaluating whether an asset is fairly priced according to CAPM. Both tools are essential: the Characteristic Line estimates the beta for each asset, while the Security Market Line uses that beta to determine the expected return based on market risk.
Mathematical Expressions and Formulas
The Characteristic Line represents the linear regression of a security's excess returns against the market's excess returns, mathematically expressed as \( R_i - R_f = \alpha_i + \beta_i (R_m - R_f) + \epsilon_i \), where \( R_i \) is the security return, \( R_f \) the risk-free rate, \( R_m \) the market return, \( \alpha_i \) the intercept (alpha), and \( \beta_i \) the slope (beta). The Security Market Line (SML) is derived from the Capital Asset Pricing Model (CAPM), expressed as \( E(R_i) = R_f + \beta_i [E(R_m) - R_f] \), depicting the expected return of a security as a function of its beta and the market risk premium. While the Characteristic Line captures empirical return relationships with market returns including alpha and residuals, the SML represents theoretical expected returns based solely on systematic risk and market equilibrium.
Key Differences between Characteristic Line and SML
The Characteristic Line (CL) represents the relationship between a specific security's excess returns and the market's excess returns, measuring the security's beta through regression analysis. The Security Market Line (SML) illustrates the expected return of assets at varying betas based on the Capital Asset Pricing Model (CAPM), depicting the trade-off between risk and return. Unlike the CL, which is asset-specific and empirical, the SML is a theoretical benchmark used to assess whether securities are fairly priced relative to their systematic risk.
Interpretation of Slope and Intercept
The slope of the Characteristic Line represents a stock's beta, measuring its sensitivity to market movements, while its intercept, known as alpha, indicates the stock's abnormal return independent of market performance. In contrast, the Security Market Line (SML) slope corresponds to the market risk premium, reflecting the expected return per unit of systematic risk, and its intercept represents the risk-free rate, serving as the baseline return for no risk. Interpreting these lines helps investors assess whether a security is under- or over-performing relative to its risk level and market expectations.
Application in Portfolio Analysis
The Characteristic Line represents the relationship between an individual asset's returns and the returns of the market portfolio, facilitating the estimation of beta for risk assessment in portfolio management. The Security Market Line, derived from the Capital Asset Pricing Model (CAPM), plots expected returns as a function of systematic risk (beta), serving as a benchmark for evaluating whether securities are fairly priced relative to their risk. Portfolio analysts use the Characteristic Line to measure an asset's sensitivity to market movements and the Security Market Line to assess if the portfolio's expected return compensates sufficiently for its systematic risk.
Limitations and Assumptions
The Characteristic Line assumes a linear relationship between an individual security's returns and market returns, which may not hold in volatile or non-normal market conditions, limiting its predictive accuracy. The Security Market Line (SML) relies on the Capital Asset Pricing Model (CAPM) assumptions, such as market efficiency, investor rationality, and a single-period investment horizon, which often do not reflect real-world complexities. Both lines face limitations in capturing multi-factor risks and behavioral anomalies, reducing their applicability in dynamic and heterogeneous financial markets.
Practical Implications for Investors
The Characteristic Line shows an individual security's relationship with market returns, highlighting its beta and specific risk, aiding investors in assessing stock volatility relative to the market. The Security Market Line (SML) represents the expected return for a given beta based on the Capital Asset Pricing Model, guiding investors in determining whether a security offers adequate risk-adjusted returns. By comparing a security's actual return against the SML, investors can identify undervalued or overvalued assets, refining portfolio construction and risk management strategies.
Characteristic Line Infographic