A polytropic line on a thermodynamic chart represents processes where the relationship between pressure and volume follows the equation \( PV^n = \text{constant} \). This concept is essential for analyzing various energy systems, including compressors, turbines, and nozzles, where it helps predict performance and efficiency. Explore the rest of this article to understand how polytropic processes influence your system design and operation.
Table of Comparison
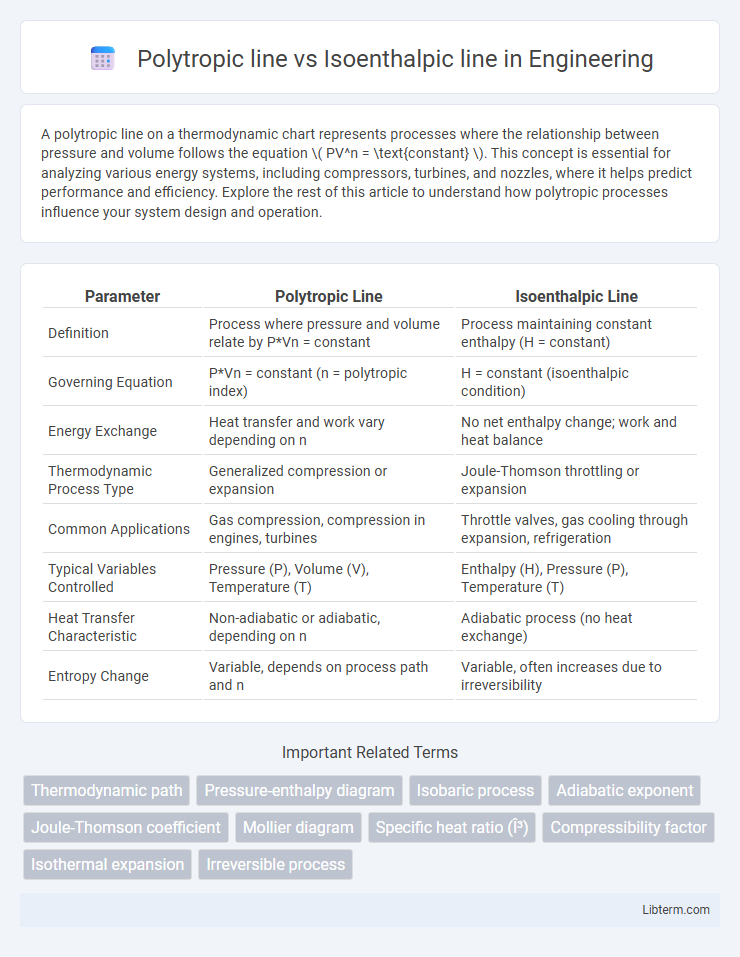
| Parameter | Polytropic Line | Isoenthalpic Line |
|---|---|---|
| Definition | Process where pressure and volume relate by P*Vn = constant | Process maintaining constant enthalpy (H = constant) |
| Governing Equation | P*Vn = constant (n = polytropic index) | H = constant (isoenthalpic condition) |
| Energy Exchange | Heat transfer and work vary depending on n | No net enthalpy change; work and heat balance |
| Thermodynamic Process Type | Generalized compression or expansion | Joule-Thomson throttling or expansion |
| Common Applications | Gas compression, compression in engines, turbines | Throttle valves, gas cooling through expansion, refrigeration |
| Typical Variables Controlled | Pressure (P), Volume (V), Temperature (T) | Enthalpy (H), Pressure (P), Temperature (T) |
| Heat Transfer Characteristic | Non-adiabatic or adiabatic, depending on n | Adiabatic process (no heat exchange) |
| Entropy Change | Variable, depends on process path and n | Variable, often increases due to irreversibility |
Introduction to Thermodynamic Processes
Polytropic and isoenthalpic lines represent distinct thermodynamic processes characterized by different energy interactions. Polytropic processes follow the relation \(PV^n = \text{constant}\), where \(n\) varies depending on heat transfer and work, capturing a wide range of realistic transformations including isothermal and adiabatic as special cases. Isoenthalpic lines depict processes with constant enthalpy, essential in throttle valve analysis and expansion valves, highlighting no change in total heat content despite variations in pressure and volume.
Understanding the Polytropic Line
The polytropic line represents a process in which the relation \( P V^n = \text{constant} \) holds, describing a variety of thermodynamic changes by adjusting the polytropic index \( n \). This line is crucial for accurately modeling real gas behavior in compressors and turbines, where heat transfer and work interactions occur simultaneously. Understanding the polytropic line helps predict system performance by bridging the gap between isentropic and isothermal processes and provides a more realistic depiction of energy transformations compared to the isoenthalpic line, which represents constant enthalpy processes.
Defining the Isoenthalpic Line
The isoenthalpic line represents a process during which the enthalpy remains constant, commonly observed in throttling or Joule-Thomson expansion where no heat or work transfer occurs. Unlike the polytropic line, which follows the relation \(PV^n = \text{constant}\) and varies entropy and enthalpy, the isoenthalpic process assumes \(H = \text{constant}\), meaning the total heat content per unit mass does not change. This distinction is critical in thermodynamics for analyzing processes like gas expansion in valves and nozzles where energy conservation is measured by enthalpy rather than pressure-volume relations.
Mathematical Representation of Polytropic and Isoenthalpic Lines
The polytropic line is mathematically represented by the equation \( PV^n = \text{constant} \), where \( P \) is pressure, \( V \) is volume, and \( n \) is the polytropic index determining the specific process path. The isoenthalpic line is defined by the condition of constant enthalpy, expressed as \( h = \text{constant} \), where \( h \) is the specific enthalpy, often described through thermodynamic property relations involving pressure and temperature. These distinct mathematical formulations highlight the different thermodynamic constraints: polytropic processes maintain a power-law relationship between pressure and volume, while isoenthalpic processes maintain constant enthalpy throughout the flow or transformation.
Key Differences Between Polytropic and Isoenthalpic Processes
Polytropic lines represent processes where the relationship between pressure and volume follows \( PV^n = \text{constant} \), allowing heat transfer and work interactions, while isoenthalpic lines depict processes at constant enthalpy with no net heat or work exchange, such as throttling. Polytropic processes can model compression or expansion with varying heat transfer, characterized by different polytropic indices \( n \), whereas isoenthalpic processes maintain steady total enthalpy, frequently used in valve or nozzle flow analysis. The key difference lies in the energy interchange: polytropic processes involve changes in internal energy and heat transfer, whereas isoenthalpic processes are isenthalpic with unchanged enthalpy despite pressure or temperature variations.
Physical Significance in Engineering Applications
The Polytropic line represents processes where pressure and volume change with a constant polytropic index, modeling real gas compression or expansion with heat transfer, essential for designing compressors and turbines. In contrast, the Isoenthalpic line depicts constant enthalpy processes, crucial for analyzing throttling valves and Joule-Thomson cooling effects in refrigeration and gas pipelines. Understanding these lines enables engineers to predict fluid behavior under varying thermodynamic conditions, optimizing performance and energy efficiency in thermal systems.
Visualization on Pressure-Volume (P-V) and Temperature-Entropy (T-S) Diagrams
Polytropic lines on Pressure-Volume (P-V) diagrams typically exhibit curved paths representing processes with a constant polytropic index, reflecting controlled heat and work interactions, while isoenthalpic lines appear as nearly vertical lines due to constant enthalpy during throttling processes. On Temperature-Entropy (T-S) diagrams, polytropic lines show gradual changes in temperature and entropy, indicating energy exchanges, whereas isoenthalpic lines run horizontally or with minimal slope, highlighting constant energy content despite entropy variation. Visualizing these lines aids in distinguishing thermodynamic process characteristics and energy transfer behaviors in system analyses.
Real-World Examples of Polytropic and Isoenthalpic Processes
Polytropic processes commonly occur in gas turbines and compressors, where the relationship between pressure and volume follows \( PV^n = \text{constant} \), allowing efficient work transfer under varying heat conditions. Isoenthalpic processes, characterized by constant enthalpy, are observed in throttling valves and Joule-Thomson expansion, crucial for refrigeration and gas liquefaction in industrial systems. These real-world applications highlight the practical impact of polytropic and isoenthalpic lines in thermodynamic cycle optimization and energy management.
Common Misconceptions and Clarifications
Polytropic lines describe processes where the polytropic index varies, encompassing multiple thermodynamic transformations, unlike isoenthalpic lines that represent constant enthalpy processes. A common misconception is treating polytropic and isoenthalpic lines as interchangeable, though the former relates to a broader range of heat and work interactions while the latter strictly implies no enthalpy change. Clarifying this distinction is crucial for accurately analyzing thermodynamic cycles, especially in compressors and turbines where enthalpy consistency governs performance.
Conclusion: Choosing the Right Process Line for Analysis
Selecting between a polytropic line and an isoenthalpic line depends on the thermodynamic process under study and the specific energy interactions involved. Polytropic lines are effective for modeling processes with heat transfer and work where the polytropic index is well-defined, while isoenthalpic lines accurately represent throttling or expansion processes with constant enthalpy. Understanding the system's constraints and energy changes ensures the choice of the appropriate process line for precise analysis and design.
Polytropic line Infographic