Root locus plots depict the trajectories of system poles in the complex plane as a key system parameter varies, crucial for analyzing stability and control system behavior. Understanding root locus helps You design controllers that achieve desired performance by adjusting pole locations to ensure system stability and responsiveness. Explore the rest of this article to learn how to interpret root locus plots and apply them effectively in control system design.
Table of Comparison
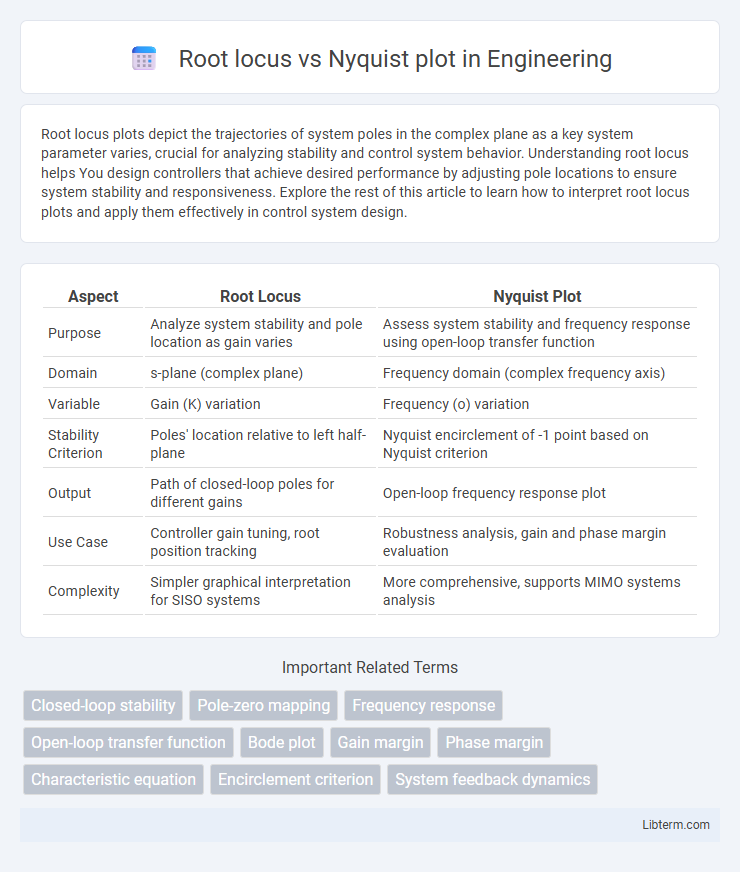
| Aspect | Root Locus | Nyquist Plot |
|---|---|---|
| Purpose | Analyze system stability and pole location as gain varies | Assess system stability and frequency response using open-loop transfer function |
| Domain | s-plane (complex plane) | Frequency domain (complex frequency axis) |
| Variable | Gain (K) variation | Frequency (o) variation |
| Stability Criterion | Poles' location relative to left half-plane | Nyquist encirclement of -1 point based on Nyquist criterion |
| Output | Path of closed-loop poles for different gains | Open-loop frequency response plot |
| Use Case | Controller gain tuning, root position tracking | Robustness analysis, gain and phase margin evaluation |
| Complexity | Simpler graphical interpretation for SISO systems | More comprehensive, supports MIMO systems analysis |
Introduction to Root Locus and Nyquist Plot
Root locus and Nyquist plot are essential tools in control system analysis used to assess system stability and performance. Root locus graphically represents the trajectories of closed-loop system poles in the complex plane as a system parameter, typically gain, varies. Nyquist plot maps the frequency response of the open-loop transfer function on the complex plane, revealing gain and phase margin to predict closed-loop stability and robustness.
Fundamental Concepts of Control System Analysis
Root locus and Nyquist plot are fundamental tools in control system analysis used to assess system stability and transient response. Root locus graphically maps the locations of system poles in the s-plane as a function of a varying gain parameter, revealing stability margins and potential oscillations. Nyquist plot represents the frequency response of the open-loop transfer function in the complex plane, enabling determination of closed-loop stability by applying the Nyquist stability criterion through encirclement of critical points.
What is Root Locus?
Root locus is a graphical method used in control systems to analyze and design the stability of a system by plotting the trajectories of closed-loop poles in the complex plane as a system parameter, typically gain, varies. It provides critical insights into system stability, transient response, and performance by showing how poles move with respect to changes in feedback gain. Engineers use root locus to determine appropriate gain values that ensure a stable and well-behaved control system.
What is Nyquist Plot?
Nyquist plot is a graphical representation of a system's frequency response used in control engineering to determine the stability of a closed-loop system by mapping the complex plane of the open-loop transfer function as frequency varies from zero to infinity. It illustrates the gain and phase characteristics, allowing engineers to assess how poles and zeros affect system stability through encirclements of the critical point (-1,0) in the complex plane. Unlike the root locus, which shows possible closed-loop pole locations as gain changes, the Nyquist plot directly evaluates stability margins and robustness for varying frequency inputs.
Mathematical Basis: Root Locus vs Nyquist Plot
Root locus analyzes the locations of system poles in the s-plane as a single parameter, typically gain, varies to assess stability and transient response. Nyquist plot represents the complex frequency response by mapping the contour of the open-loop transfer function \(G(s)H(s)\) around the critical point \(-1+0j\), using the Nyquist stability criterion to evaluate closed-loop stability. While root locus uses algebraic equations derived from the characteristic equation \(1 + KG(s)H(s) = 0\), Nyquist plot leverages the argument principle and encirclement of the \(-1\) point to determine stability margins and robustness.
Applications in Stability Analysis
Root locus plots depict how system poles move in the complex plane with varying gain, enabling designers to assess stability margins and adjust controller parameters for desired stability. Nyquist plots analyze frequency response by mapping the open-loop transfer function encirclements around the critical point, directly revealing closed-loop stability and gain/phase margins. Control engineers use root locus for tuning feedback systems during design phases, while Nyquist plots are essential for validating stability under varying frequency conditions and assessing robustness against uncertainties.
Visualization and Interpretation Differences
Root locus plots visualize the trajectories of system poles in the s-plane as a gain parameter varies, directly illustrating stability margins and transient response characteristics. Nyquist plots represent the frequency response by mapping the complex open-loop transfer function, revealing gain and phase margins through encirclements of the critical point (-1,0). While root locus emphasizes pole movement for stability and control design, Nyquist plot focuses on frequency-domain stability criteria and robustness insights.
Advantages and Limitations of Each Method
Root locus provides a clear visualization of how system poles move with varying gain, enabling straightforward stability and transient response analysis for single-input single-output (SISO) control systems. Its limitation lies in handling only linear, time-invariant systems and challenges with multi-variable systems. Nyquist plots excel in assessing stability through encirclement criteria, accommodating open-loop frequency response data and offering robustness insights against model uncertainties, but they require complex interpretation and may be less intuitive for tracking pole-zero movement directly.
Choosing Between Root Locus and Nyquist Plot
Root locus and Nyquist plot are essential tools for analyzing control system stability, each providing unique insights suited to different design phases. Root locus excels in visualizing how closed-loop poles migrate with varying gain, making it ideal for tuning parameters to achieve desired transient response and stability margins. Nyquist plot offers a comprehensive frequency domain perspective, effectively assessing robustness and stability against gain and phase variations, crucial for systems with feedback and potential nonlinearities.
Summary: Key Takeaways and Recommendations
Root locus plots illustrate the movement of system poles as gain varies, providing intuitive insight into stability and transient response, while Nyquist plots analyze frequency response to assess closed-loop stability through encirclements of critical points. Root locus is recommended for designing compensators focused on pole placement and time-domain behavior, whereas Nyquist plots are essential for verifying gain and phase margins in frequency-domain stability analysis. Combining both methods offers a comprehensive approach to control system design, ensuring robust performance across varying operating conditions.
Root locus Infographic