The Smith chart is an essential tool in radio frequency (RF) engineering used for solving problems involving transmission lines and impedance matching. It graphically represents complex impedance and reflection coefficients, making it easier to visualize how components interact within a circuit. Explore the rest of the article to understand how the Smith chart can optimize your RF designs effectively.
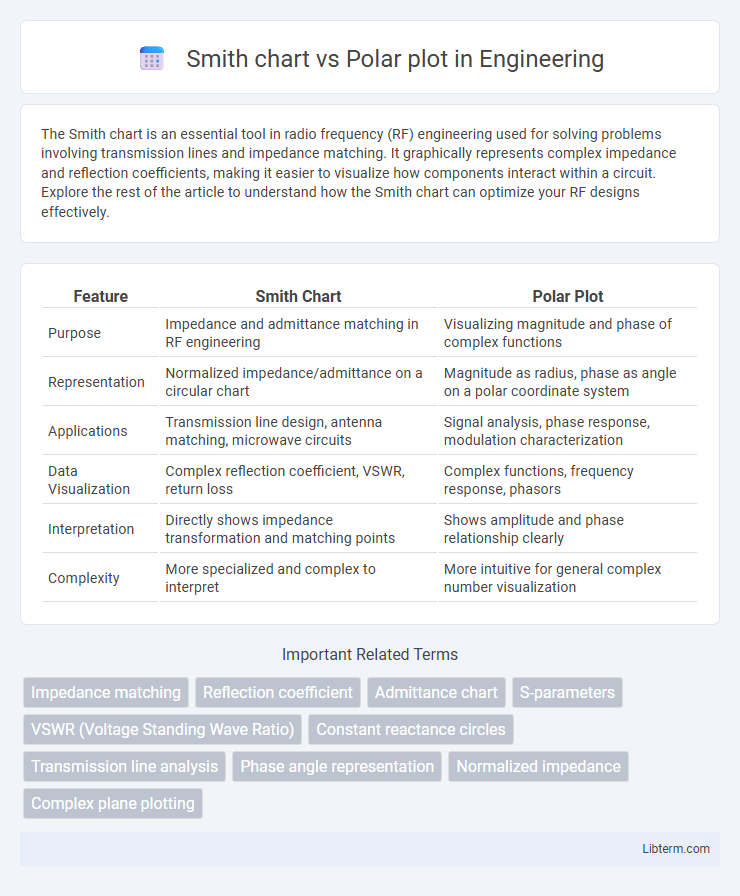
Table of Comparison
| Feature | Smith Chart | Polar Plot |
|---|---|---|
| Purpose | Impedance and admittance matching in RF engineering | Visualizing magnitude and phase of complex functions |
| Representation | Normalized impedance/admittance on a circular chart | Magnitude as radius, phase as angle on a polar coordinate system |
| Applications | Transmission line design, antenna matching, microwave circuits | Signal analysis, phase response, modulation characterization |
| Data Visualization | Complex reflection coefficient, VSWR, return loss | Complex functions, frequency response, phasors |
| Interpretation | Directly shows impedance transformation and matching points | Shows amplitude and phase relationship clearly |
| Complexity | More specialized and complex to interpret | More intuitive for general complex number visualization |
Introduction to Smith Chart and Polar Plot
The Smith Chart is a graphical tool used extensively in RF engineering to represent complex impedance and reflection coefficients on a normalized plane, aiding in impedance matching and network analysis. The Polar Plot displays complex numbers as points defined by magnitude and phase, offering a straightforward visualization of signal variations and phase shifts. Both tools serve crucial roles in microwave circuit design, frequency response analysis, and antenna characterization but differ in their approach to representing complex data.
Fundamentals of Smith Chart
The Smith chart is a powerful graphical tool used primarily in RF engineering to represent complex impedance and reflection coefficients, facilitating the analysis and design of transmission lines and matching networks. Unlike a polar plot that displays magnitude and phase of a signal on a circular graph, the Smith chart maps normalized impedance or admittance on a complex plane, enabling visualization of impedance transformations along transmission lines. Its fundamental advantage lies in combining multiple parameters--resistance, reactance, reflection coefficient magnitude, and phase--into a single plot for efficient circuit analysis and impedance matching.
Basics of Polar Plot
A polar plot represents data points in terms of magnitude and angle on a circular grid, ideal for visualizing complex numbers and phase relationships. It maps the radius as the amplitude and the angle as the phase, enabling clear interpretation of periodic or oscillatory behavior in signals. Unlike the Smith chart, which specifically aids in impedance matching and RF circuit analysis, the polar plot provides a more general representation for various engineering applications involving angular data.
Key Applications in RF Engineering
Smith charts are primarily used for impedance matching and analyzing complex reflection coefficients in RF circuit design, enabling engineers to visualize and optimize transmission line parameters effectively. Polar plots serve as crucial tools for displaying antenna radiation patterns and phase responses, providing intuitive insight into signal magnitude and phase behavior over a range of frequencies. Both visualization methods enhance RF engineering tasks by simplifying the interpretation of complex data related to signal integrity and system performance.
Representation of Impedance and Admittance
The Smith chart graphically represents complex impedance and admittance using normalized parameters, allowing simultaneous visualization of resistance and reactance on a circular plot. It maps impedance values onto a unit circle, enabling easy determination of reflection coefficients and matching conditions in RF circuits. The polar plot, by contrast, displays impedance or admittance magnitude and phase as a function of frequency on a radial grid, emphasizing amplitude and angle but lacking the ability to separate resistance and reactance components directly.
Visualization of Reflection Coefficient
The Smith chart provides a comprehensive visualization of the reflection coefficient by mapping complex impedance and admittance values onto a normalized unit circle, enabling intuitive analysis of both magnitude and phase. Polar plots, meanwhile, represent the reflection coefficient purely in terms of magnitude and angle, offering a straightforward angular perspective without detailing impedance transformations. For applications requiring detailed impedance matching and network behavior insights, the Smith chart delivers a more informative and semantically rich visualization compared to the simpler polar plot.
Data Interpretation Differences
The Smith chart and polar plot both represent complex impedance and reflection coefficients but differ in data interpretation. The Smith chart displays normalized impedance and admittance values on a circular grid, enabling simultaneous visualization of resistance, reactance, and matching conditions. In contrast, the polar plot maps magnitude and phase angles directly on a circular coordinate system, emphasizing reflection coefficient magnitude and phase without explicit impedance normalization.
Advantages of Smith Chart
The Smith chart offers a powerful graphical tool for analyzing complex impedance and reflection coefficients, making it essential in high-frequency circuit design and RF engineering. It enables simultaneous visualization of resistance and reactance, simplifying impedance matching and network parameter calculations compared to the more limited magnitude and phase representation of the polar plot. Engineers benefit from the Smith chart's ability to intuitively interpret transmission line behaviors, standing wave ratios, and complex reflection coefficients, which enhances accuracy and efficiency in RF design tasks.
Benefits of Polar Plot
Polar plots provide clear visualization of complex impedance and reflectance in a straightforward circular format, making it easier to interpret phase and magnitude relationships. Their simplicity allows engineers to quickly analyze antenna radiation patterns and signal phase shifts without the need for complex transformations. Polar plots effectively highlight symmetry and periodicity in data, enhancing the identification of patterns that are less obvious in Smith charts.
Choosing Between Smith Chart and Polar Plot
Choosing between the Smith chart and polar plot depends on the specific RF engineering application and data representation needs. The Smith chart excels in visualizing complex impedance, reflection coefficients, and matching networks, making it indispensable for transmission line and antenna design. In contrast, the polar plot is preferred for illustrating amplitude and phase variations in periodic signals or frequency response, offering clearer insights into signal behavior without the impedance context.
Smith chart Infographic