A Bode plot graphically represents a system's frequency response through magnitude and phase plots on logarithmic scales, essential for analyzing control systems and filters. It helps you understand how a system amplifies or attenuates signals at different frequencies and shifts their phase, crucial for stability and performance assessment. Explore the rest of this article to master Bode plot interpretation and application techniques.
Table of Comparison
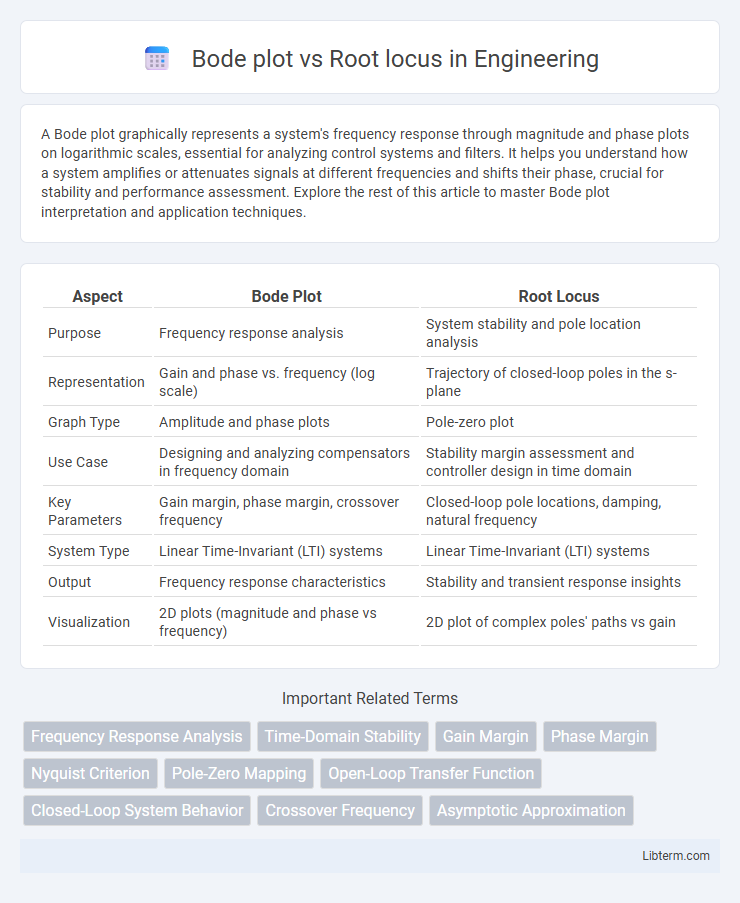
| Aspect | Bode Plot | Root Locus |
|---|---|---|
| Purpose | Frequency response analysis | System stability and pole location analysis |
| Representation | Gain and phase vs. frequency (log scale) | Trajectory of closed-loop poles in the s-plane |
| Graph Type | Amplitude and phase plots | Pole-zero plot |
| Use Case | Designing and analyzing compensators in frequency domain | Stability margin assessment and controller design in time domain |
| Key Parameters | Gain margin, phase margin, crossover frequency | Closed-loop pole locations, damping, natural frequency |
| System Type | Linear Time-Invariant (LTI) systems | Linear Time-Invariant (LTI) systems |
| Output | Frequency response characteristics | Stability and transient response insights |
| Visualization | 2D plots (magnitude and phase vs frequency) | 2D plot of complex poles' paths vs gain |
Introduction to Bode Plot and Root Locus
Bode plots graphically represent the frequency response of a system by plotting magnitude and phase against frequency on a logarithmic scale, essential for analyzing system stability and performance in control engineering. Root locus illustrates the trajectories of system poles in the complex plane as a system parameter, typically gain, varies, providing insight into system stability and transient behavior. Both tools serve complementary roles in control system design, with Bode plots emphasizing frequency domain characteristics and Root locus focusing on time-domain pole placement.
Fundamental Concepts of Frequency and Time Domain Analysis
Bode plots visualize a system's frequency response by graphing gain and phase against frequency, crucial for analyzing stability and performance in the frequency domain. Root locus plots depict the trajectories of system poles in the complex plane as a parameter, typically gain, varies, providing insights into stability and transient response in the time domain. Both tools enable comprehensive control system analysis by linking frequency-domain characteristics with time-domain behavior for robust design and stability assessment.
What is a Bode Plot?
A Bode plot is a graphical representation used in control systems and signal processing to depict a system's frequency response, illustrating magnitude and phase versus frequency on a logarithmic scale. It helps engineers analyze the stability and performance of linear time-invariant systems by showing gain margins and phase margins. Unlike root locus plots, which map system poles and zeros as a parameter varies, Bode plots provide insight into how a system responds to different frequencies, making them crucial for designing robust controllers.
What is Root Locus?
Root locus is a graphical method used in control systems to determine how the roots of a system's characteristic equation change with varying parameters, typically gain. This plot helps analyze system stability and transient response by showing the trajectories of poles in the complex plane. Unlike Bode plots that focus on frequency response, root locus emphasizes pole location to design controllers for desired dynamic performance.
Key Differences Between Bode Plot and Root Locus
Bode plot represents system frequency response by plotting gain and phase versus frequency on a logarithmic scale, enabling stability and performance analysis in the frequency domain. Root locus illustrates the trajectories of system poles in the complex plane as a system parameter, typically gain, varies, providing insight into system stability and transient response in the time domain. Key differences include Bode plot's emphasis on frequency-dependent behavior and gain margin, phase margin, while root locus focuses on pole-zero movement and changes in system stability with gain variations.
Applications of Bode Plot in Control Systems
Bode plots are essential in control systems for analyzing frequency response, stability margins, and gain/phase characteristics, enabling engineers to design robust feedback controllers and compensate system dynamics effectively. They provide clear insights into bandwidth, resonance peaks, and phase delay, facilitating tuning of PID controllers and ensuring desired performance under varying operating conditions. Root locus, in contrast, focuses on pole-zero movement with gain variation, making Bode plots more suitable for frequency-domain stability assessment and controller frequency tuning.
Applications of Root Locus in System Design
Root locus is extensively used in control system design to analyze and adjust the stability and transient response by plotting the trajectories of closed-loop poles as system parameters vary. Engineers utilize root locus to determine gain values that ensure desired damping ratios and natural frequencies, facilitating precise tuning of controllers such as PID. Unlike Bode plots that provide frequency response insights, root locus offers direct visualization of pole movement, crucial for designing robust and stable control systems.
Advantages and Limitations of Bode Plot
Bode plots provide a clear frequency response visualization, making it easier to analyze system stability and bandwidth by displaying gain and phase margins directly. They are particularly advantageous for designing and tuning controllers in the frequency domain but may lack detailed insight into transient response and pole-zero locations compared to root locus plots. However, Bode plots can be limited in handling non-minimum phase systems and may not fully represent closed-loop pole dynamics essential for comprehensive stability analysis.
Advantages and Limitations of Root Locus
Root locus plots clearly illustrate how the locations of poles change with varying system parameters, enabling straightforward stability analysis and controller design. It effectively reveals the range of gain values for system stability but struggles with nonlinear or higher-order systems due to complexity in interpreting multiple branches. Unlike Bode plots, root locus does not directly provide frequency response information, limiting its use in designing frequency-specific controllers.
Choosing Between Bode Plot and Root Locus: Practical Guidelines
Bode plots provide frequency response insights crucial for analyzing system stability and bandwidth, making them ideal for designing compensators in control systems. Root locus plots map the trajectory of closed-loop poles as system gain varies, enabling precise pole placement and stability margin assessment. Choose Bode plots for frequency-domain specifications and gain/phase margin evaluation, while root locus is preferred for time-domain pole manipulation and understanding system behavior under parameter changes.
Bode plot Infographic