Function Block Diagram (FBD) is a graphical programming language used for designing and visualizing control systems, making complex logic easier to understand and implement. It represents functions as blocks interconnected with lines to illustrate data flow, allowing engineers to efficiently program automation sequences. Explore the rest of the article to learn how Function Block Diagrams can enhance your control system designs and streamline your engineering processes.
Table of Comparison
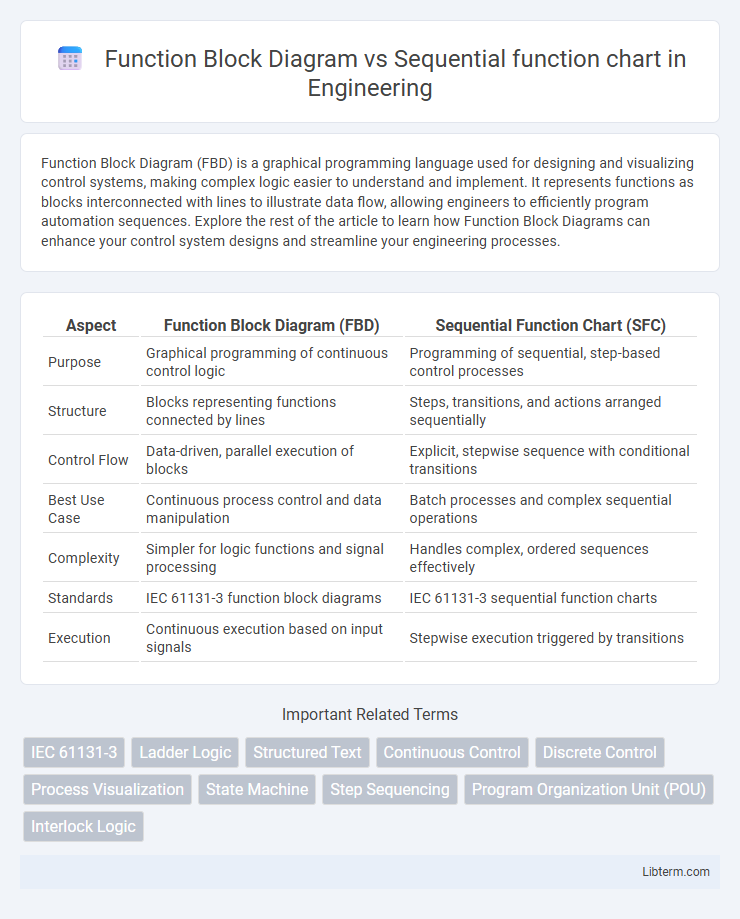
| Aspect | Function Block Diagram (FBD) | Sequential Function Chart (SFC) |
|---|---|---|
| Purpose | Graphical programming of continuous control logic | Programming of sequential, step-based control processes |
| Structure | Blocks representing functions connected by lines | Steps, transitions, and actions arranged sequentially |
| Control Flow | Data-driven, parallel execution of blocks | Explicit, stepwise sequence with conditional transitions |
| Best Use Case | Continuous process control and data manipulation | Batch processes and complex sequential operations |
| Complexity | Simpler for logic functions and signal processing | Handles complex, ordered sequences effectively |
| Standards | IEC 61131-3 function block diagrams | IEC 61131-3 sequential function charts |
| Execution | Continuous execution based on input signals | Stepwise execution triggered by transitions |
Introduction to Function Block Diagram (FBD) and Sequential Function Chart (SFC)
Function Block Diagram (FBD) is a graphical programming language widely used in industrial automation for designing control systems by connecting functional blocks representing operations or logic functions. Sequential Function Chart (SFC) organizes control processes into steps and transitions, enabling clear visualization of sequential operations and state-based control flows. Both FBD and SFC are integral parts of the IEC 61131-3 standard for programmable logic controller (PLC) programming, facilitating modular, reusable, and maintainable automation software design.
Understanding the Basics of FBD
Function Block Diagram (FBD) represents a graphical programming language used in industrial control systems, emphasizing the connection of function blocks to perform logical operations and control processes. Sequential Function Chart (SFC) focuses on illustrating the sequence of steps and transitions in process automation, highlighting control flow rather than function complexity. Understanding the basics of FBD involves mastering its modular approach, where individual function blocks encapsulate specific tasks, enabling clear visualization and efficient troubleshooting of control logic.
Key Concepts of SFC
Sequential Function Chart (SFC) organizes industrial control processes into discrete steps and transitions, enabling clear visualization of process sequences and state changes. Unlike Function Block Diagram (FBD), which is primarily data flow-oriented, SFC emphasizes the control flow by defining the execution order and synchronization of steps through transitions and actions. Key concepts of SFC include steps, transitions, actions, and the ability to represent parallelism and conditional branching, facilitating structured programming of complex automation tasks.
Visual Representation Differences
Function Block Diagram (FBD) displays control functions as interconnected blocks, each representing a specific operation, making it easy to visualize signal flow and modular programming. Sequential Function Chart (SFC) organizes control processes as steps and transitions, illustrating the sequence of operations with clear decision points and parallel activity paths. The visual distinction lies in FBD's focus on functional interconnections versus SFC's emphasis on stepwise logic and process progression.
Programming Logic and Structure Comparison
Function Block Diagram (FBD) emphasizes graphical programming with interconnected function blocks representing operations and data flow, enabling modular and reusable code segments. Sequential Function Chart (SFC) organizes control logic into steps and transitions, providing clear state-based sequencing suitable for complex process control and event-driven tasks. Both methods enhance readability and maintainability but differ in structure: FBD excels at parallel operations, while SFC is optimized for stepwise execution and process visualization.
Applications and Use Cases for FBD
Function Block Diagram (FBD) is widely used in industrial automation for programming continuous process control and complex logic structures, making it ideal for applications like motor control, PID loops, and signal processing. Its graphical representation simplifies diagnostics and maintenance in chemical plants, manufacturing lines, and HVAC systems. Compared to Sequential Function Chart (SFC), which excels in modeling step-by-step sequences, FBD provides a more intuitive approach for real-time data handling and repetitive control tasks.
Applications and Use Cases for SFC
Sequential Function Chart (SFC) excels in applications requiring clear visualization of sequential operations and complex process control, such as batch processing in chemical industries and automated assembly lines. SFC's structured step-transition-action framework enables precise control and monitoring of interdependent tasks, making it ideal for manufacturing automation and system diagnostics. Compared to Function Block Diagram (FBD), SFC is preferred for workflows with discrete sequential steps and conditional logic, enhancing readability and maintainability in systems with intricate state-based processes.
Advantages and Limitations of FBD
Function Block Diagram (FBD) offers a visual programming approach that simplifies complex control algorithms by representing functions as interconnected blocks, enhancing readability and ease of maintenance in industrial automation. FBD's advantages include intuitive design, rapid development, and straightforward debugging, which improve efficiency in programming programmable logic controllers (PLCs). However, its limitations involve less suitability for sequential or step-based processes, where Sequential Function Charts (SFC) excel due to better handling of states and transitions in complex workflows.
Advantages and Limitations of SFC
Sequential Function Chart (SFC) offers clear visualization of complex control sequences, making it easier to design and troubleshoot multi-step processes with defined transitions and steps. Its modular structure enhances maintainability and scalability in automation projects, but SFC can be less intuitive for representing continuous or parallel operations compared to Function Block Diagram (FBD). Limitations of SFC include potential verbosity and increased complexity when handling highly concurrent or time-critical tasks, which may require integration with other languages like FBD for efficient implementation.
Choosing Between FBD and SFC: Which Is Best for Your Project?
Function Block Diagram (FBD) excels in continuous process control and complex signal processing with its intuitive graphical representation of function blocks, making it ideal for projects requiring straightforward data flow visualization. Sequential Function Chart (SFC) specializes in clearly defining sequential operations with steps and transitions, offering superior control for processes with distinct states or phases, such as batch processing or automated workflows. Choosing between FBD and SFC depends on project needs: prioritize FBD for continuous control and signal integration, and select SFC for managing ordered sequences and event-driven tasks.
Function Block Diagram Infographic