The marginal rate of substitution (MRS) measures the rate at which a consumer is willing to exchange one good for another while maintaining the same level of utility. Understanding MRS helps in analyzing consumer preferences and decision-making processes. Discover how mastering this concept can enhance your grasp of economic behavior by reading the rest of the article.
Table of Comparison
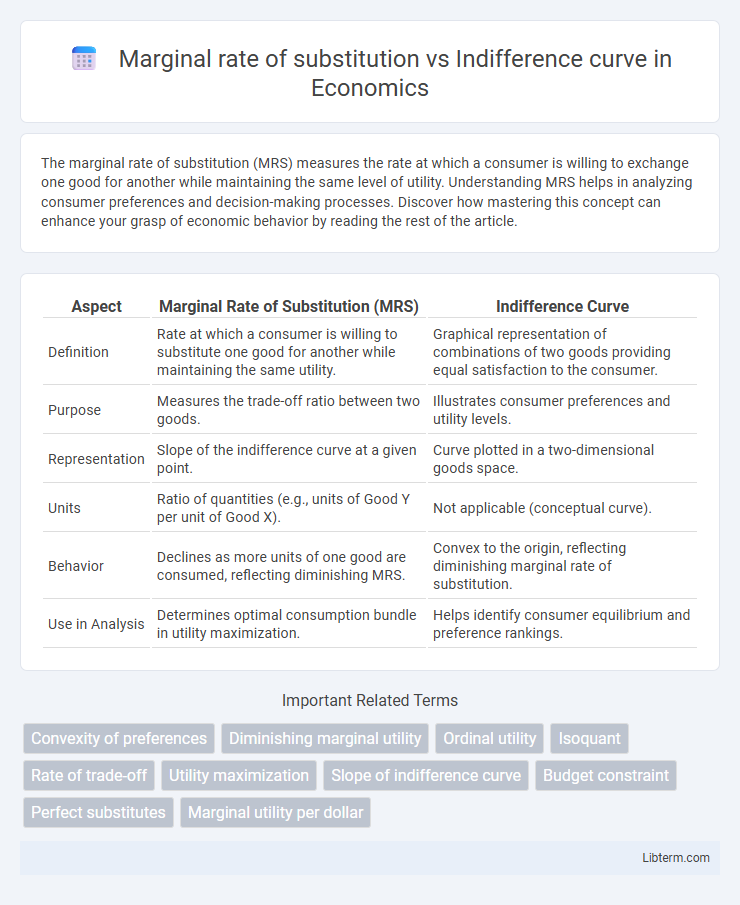
| Aspect | Marginal Rate of Substitution (MRS) | Indifference Curve |
|---|---|---|
| Definition | Rate at which a consumer is willing to substitute one good for another while maintaining the same utility. | Graphical representation of combinations of two goods providing equal satisfaction to the consumer. |
| Purpose | Measures the trade-off ratio between two goods. | Illustrates consumer preferences and utility levels. |
| Representation | Slope of the indifference curve at a given point. | Curve plotted in a two-dimensional goods space. |
| Units | Ratio of quantities (e.g., units of Good Y per unit of Good X). | Not applicable (conceptual curve). |
| Behavior | Declines as more units of one good are consumed, reflecting diminishing MRS. | Convex to the origin, reflecting diminishing marginal rate of substitution. |
| Use in Analysis | Determines optimal consumption bundle in utility maximization. | Helps identify consumer equilibrium and preference rankings. |
Introduction to Marginal Rate of Substitution and Indifference Curves
Marginal Rate of Substitution (MRS) measures the rate at which a consumer is willing to exchange one good for another while maintaining the same level of utility, reflecting the slope of the Indifference Curve at any given point. Indifference Curves represent combinations of two goods that provide the consumer with equal satisfaction, illustrating consumer preferences and trade-offs without revealing absolute utility levels. The relationship between MRS and Indifference Curves is fundamental in consumer theory, as MRS quantifies the consumer's willingness to substitute goods along the curve.
Defining Marginal Rate of Substitution (MRS)
The marginal rate of substitution (MRS) quantifies the rate at which a consumer is willing to exchange one good for another while maintaining the same level of utility, represented mathematically as the absolute slope of the indifference curve at any given point. An indifference curve illustrates combinations of two goods that provide equal satisfaction, where the MRS varies along the curve due to the diminishing willingness to substitute one good as its quantity changes. Understanding MRS is essential for analyzing consumer preferences and optimizing consumption bundles in microeconomic theory.
Understanding Indifference Curves
Indifference curves represent combinations of goods between which a consumer is indifferent, illustrating consumer preferences and satisfaction levels. The Marginal Rate of Substitution (MRS) quantifies the rate at which a consumer is willing to trade one good for another while maintaining the same level of utility, reflected by the slope of the indifference curve at any point. Understanding indifference curves involves analyzing their convex shape, which indicates diminishing MRS and consistent consumer preference patterns.
Key Differences Between MRS and Indifference Curves
The Marginal Rate of Substitution (MRS) measures the rate at which a consumer is willing to give up one good for another while maintaining the same utility, represented as the slope of the Indifference Curve at any given point. Indifference Curves graphically depict combinations of two goods that yield equal satisfaction, illustrating consumer preferences without specifying substitution rates. Key differences include that MRS is a dynamic rate reflecting marginal trade-offs, whereas Indifference Curves are static representations of constant utility levels across different commodity bundles.
Mathematical Representation of MRS
The Marginal Rate of Substitution (MRS) quantifies the rate at which a consumer is willing to exchange one good for another while maintaining the same utility level, mathematically expressed as the negative slope of the indifference curve. Specifically, MRS = - (dY/dX) = MUx / MUy, where MUx and MUy denote the marginal utilities of goods X and Y, respectively. The indifference curve represents combinations of goods offering equal utility, and its slope at any point directly reflects the MRS, emphasizing its role in consumer choice optimization.
Properties of Indifference Curves
Indifference curves represent combinations of goods providing equal satisfaction, characterized by being downward sloping and convex to the origin due to diminishing marginal rate of substitution (MRS). The marginal rate of substitution measures the rate at which a consumer is willing to exchange one good for another while maintaining constant utility, causing the slope of the indifference curve to decrease as one moves along it. Indifference curves never intersect and higher curves indicate higher utility levels, reinforcing their properties linked to consumer preferences and MRS behavior.
Relationship Between MRS and Indifference Curves
The Marginal Rate of Substitution (MRS) measures the rate at which a consumer is willing to trade one good for another while maintaining the same utility level, represented by points along an indifference curve. The slope of an indifference curve at any given point equals the MRS, reflecting the diminishing willingness to substitute goods as consumption changes. Therefore, MRS is the absolute value of the slope of the indifference curve, illustrating the consumer's changing preferences along the curve.
Real-World Applications in Consumer Choice Theory
The marginal rate of substitution (MRS) quantifies the rate at which a consumer is willing to exchange one good for another while maintaining the same utility level, directly influencing the shape of indifference curves in consumer choice theory. In real-world applications, businesses use MRS to predict consumer preferences and optimize product bundles, enabling tailored marketing strategies that maximize consumer satisfaction and firm profit. Indifference curves help economists analyze consumer behavior by illustrating combinations of goods providing equal utility, aiding in demand forecasting and policy-making decisions related to pricing and resource allocation.
Limitations and Assumptions of MRS and Indifference Curves
Marginal rate of substitution (MRS) assumes that preferences are continuously differentiable and that consumers have consistent, convex preferences, which may not hold in real-world scenarios with discrete choices or non-convex preferences. Indifference curves rely on the assumption of perfect substitutability or complementarity between goods, ignoring factors like budget constraints, income effects, and external influences that affect consumer decisions. Both concepts face limitations in capturing dynamic changes in preferences and the impact of behavioral anomalies such as satiation or preference reversals.
Conclusion: Comparative Insights on MRS vs Indifference Curves
Marginal Rate of Substitution (MRS) quantifies the rate at which a consumer is willing to trade one good for another while maintaining the same level of utility, representing the slope of an indifference curve at any given point. Indifference curves depict combinations of goods that provide equal satisfaction, illustrating consumer preferences and helping visualize the trade-offs measured by the MRS. Comparing the two, MRS offers a precise, numerical measure of substitution preferences, whereas indifference curves provide a graphical representation of those preferences, together forming the foundation for understanding consumer choice behavior in microeconomics.
Marginal rate of substitution Infographic