Network performance monitoring ensures your IT infrastructure operates efficiently by continuously tracking metrics such as latency, bandwidth, and packet loss. Proactive detection of network bottlenecks and anomalies helps maintain optimal uptime and enhances overall user experience. Explore the rest of the article to discover strategies and tools that can boost your network's performance.
Table of Comparison
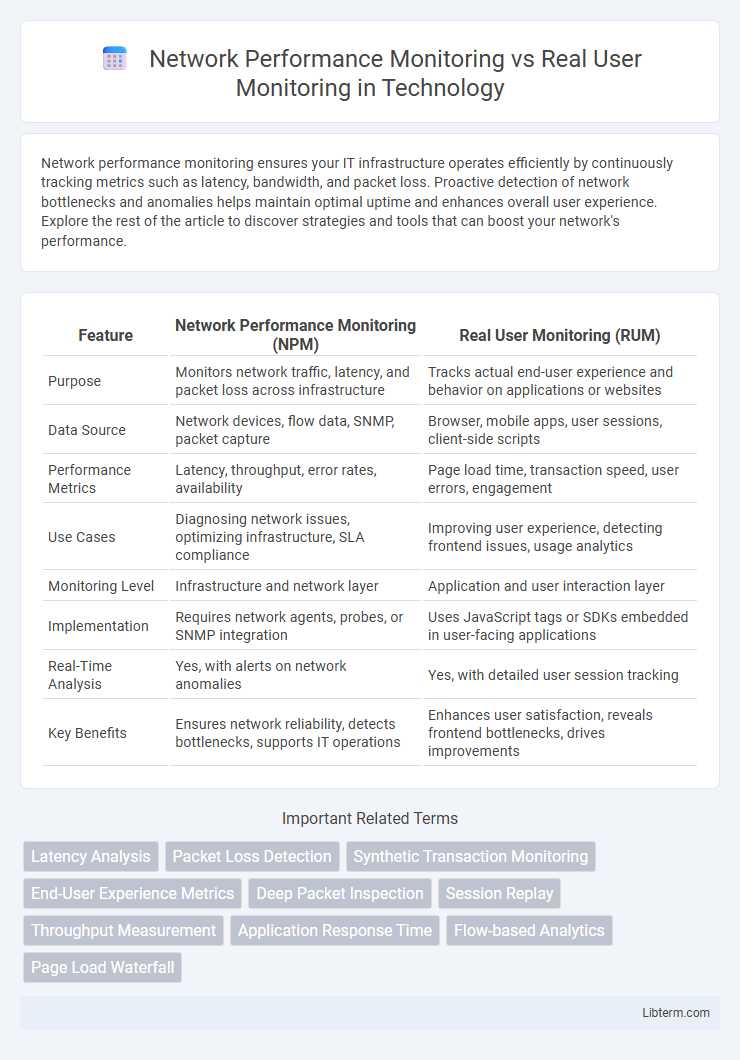
| Feature | Network Performance Monitoring (NPM) | Real User Monitoring (RUM) |
|---|---|---|
| Purpose | Monitors network traffic, latency, and packet loss across infrastructure | Tracks actual end-user experience and behavior on applications or websites |
| Data Source | Network devices, flow data, SNMP, packet capture | Browser, mobile apps, user sessions, client-side scripts |
| Performance Metrics | Latency, throughput, error rates, availability | Page load time, transaction speed, user errors, engagement |
| Use Cases | Diagnosing network issues, optimizing infrastructure, SLA compliance | Improving user experience, detecting frontend issues, usage analytics |
| Monitoring Level | Infrastructure and network layer | Application and user interaction layer |
| Implementation | Requires network agents, probes, or SNMP integration | Uses JavaScript tags or SDKs embedded in user-facing applications |
| Real-Time Analysis | Yes, with alerts on network anomalies | Yes, with detailed user session tracking |
| Key Benefits | Ensures network reliability, detects bottlenecks, supports IT operations | Enhances user satisfaction, reveals frontend bottlenecks, drives improvements |
Introduction to Network Performance Monitoring vs Real User Monitoring
Network Performance Monitoring (NPM) measures the health and efficiency of network infrastructures by analyzing data flow, packet loss, latency, and bandwidth usage to ensure optimal network functionality. Real User Monitoring (RUM) captures and analyzes actual user interactions and experiences with applications and websites in real time, providing insights into page load times, transaction paths, and user behavior. Both approaches offer critical visibility, with NPM focusing on backend network metrics and RUM emphasizing frontend user experience for comprehensive performance management.
Defining Network Performance Monitoring (NPM)
Network Performance Monitoring (NPM) involves the continuous measurement and analysis of network traffic, latency, packet loss, and bandwidth utilization to ensure optimal network health and performance. It uses tools like SNMP, flow data, and synthetic transactions to detect, diagnose, and resolve network issues proactively. NPM provides deep insights into network infrastructure performance, helping IT teams maintain high availability and prevent downtime.
What Is Real User Monitoring (RUM)?
Real User Monitoring (RUM) is a passive monitoring technique that captures and analyzes actual user interactions with a website or application in real time, providing insights into user experience, performance metrics, and potential bottlenecks from the end-user perspective. It collects data on page load times, transaction times, errors, and user behavior without synthetic scripts, enabling businesses to understand how applications perform under real-world conditions. RUM complements Network Performance Monitoring (NPM) by focusing on the client side, capturing data from browsers or devices, while NPM primarily tracks network infrastructure health and traffic flow.
Key Differences Between NPM and RUM
Network Performance Monitoring (NPM) focuses on analyzing network infrastructure metrics such as latency, packet loss, and bandwidth utilization to identify bottlenecks and optimize traffic flow. Real User Monitoring (RUM) captures actual user interactions and experiences by tracking page load times, transaction success rates, and browser or device performance to measure end-user satisfaction. NPM provides an internal network health overview, while RUM delivers insights into real-time user behavior and frontend application performance.
How NPM Works in IT Environments
Network Performance Monitoring (NPM) works in IT environments by continuously analyzing data packets and network traffic to detect latency, packet loss, and throughput issues in real-time. It leverages protocols such as SNMP, NetFlow, and packet capture to collect detailed performance metrics from routers, switches, and servers, enabling proactive identification of network bottlenecks and failures. This constant flow of data allows IT teams to maintain optimal network health and swiftly resolve infrastructure problems before they impact end users.
How RUM Captures User Experience
Real User Monitoring (RUM) captures user experience by collecting data directly from actual user interactions with a website or application, measuring parameters such as page load times, transaction speeds, and error rates in real time. It provides granular insights into network performance from the end-user perspective, highlighting performance issues that synthetic probes in Network Performance Monitoring (NPM) might miss. By analyzing browser behavior, device types, and geographic locations, RUM enables precise identification of performance bottlenecks affecting real users.
Benefits of Network Performance Monitoring
Network Performance Monitoring (NPM) delivers precise insights into network infrastructure health, identifying bottlenecks, latency, packet loss, and throughput issues in real-time to ensure optimal connectivity. By continuously tracking network device performance and traffic patterns, NPM enhances proactive troubleshooting and reduces downtime, leading to improved service reliability and user experience. Unlike Real User Monitoring (RUM), which focuses on end-user application interaction, NPM provides comprehensive visibility into the underlying network, enabling IT teams to optimize performance and maintain robust network security.
Advantages of Real User Monitoring
Real User Monitoring (RUM) captures authentic user interactions, providing precise insights into how real users experience application performance across various devices and locations, unlike synthetic tests used in Network Performance Monitoring (NPM). RUM offers granular data on actual load times, server response, and user behavior, enabling targeted performance optimization and enhanced user satisfaction. This contextual, user-centric approach helps businesses prioritize fixes based on genuine impact rather than simulated scenarios, driving more effective improvements.
Use Cases: When to Use NPM or RUM
Network Performance Monitoring (NPM) is ideal for diagnosing and optimizing backend infrastructure, tracking server response times, and identifying network bottlenecks to ensure system reliability and reduce downtime. Real User Monitoring (RUM) is essential for assessing actual user experiences, capturing frontend performance metrics, and understanding how real users interact with applications across different devices and geographies. Use NPM when focusing on network health and infrastructure optimization, while RUM is best for improving user satisfaction and frontend performance based on real-time user data.
Choosing the Right Monitoring Solution for Your Business
Network Performance Monitoring (NPM) focuses on analyzing the infrastructure, including routers, switches, and traffic flow to identify issues impacting network speed and availability, making it ideal for IT teams managing complex environments. Real User Monitoring (RUM) captures actual user interactions and experience metrics from web and mobile applications, providing insights into performance from the end-user's perspective, which benefits customer-centric businesses. Selecting the right monitoring solution depends on your business goals: choose NPM for backend infrastructure health and RUM for optimizing user experience and engagement.
Network Performance Monitoring Infographic